XRP Price Falls Out of Its Channel, $0.99 Four Cents Away
XRP has fallen out of the channel that held every dip since late September, dropping 4.7% to $1.05 on Tuesday with a low just four cents above its August base.
Key Takeaways
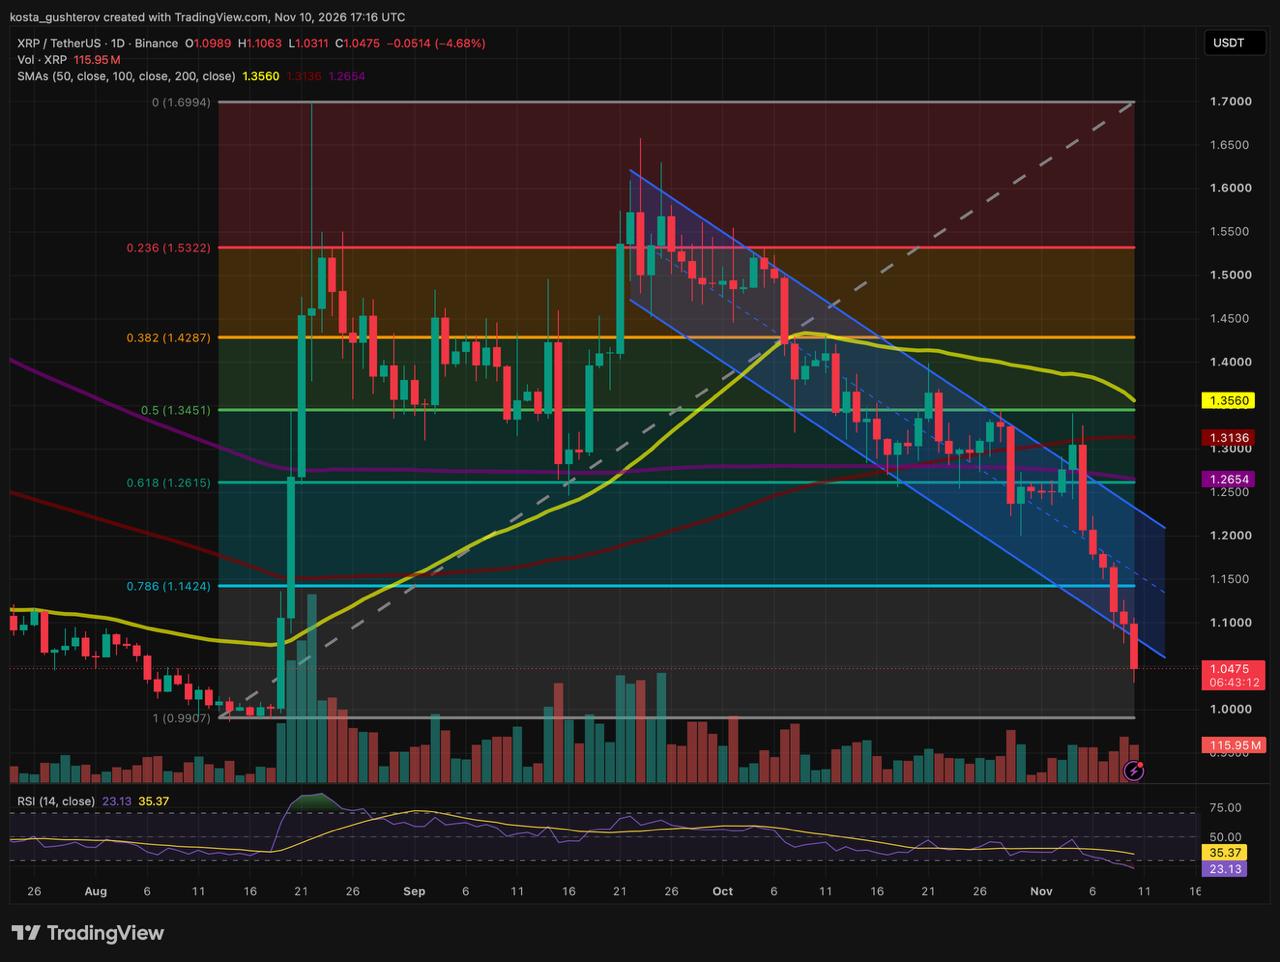
Coindoo’s November 8 analysis set the sequence: a close under the 0.786 near $1.14 would leave the lower channel rail near $1.11 as the last line, and losing that could expose $1.05 and then $0.99. On the Binance daily chart at 17:16 UTC, XRP trades at $1.05, down 4.68% on the day.
Two sessions, two floors
The weekend pause near $1.16 did not last. Monday’s candle went through the 0.786 near $1.14 and kept going, out through the bottom of the blue channel that had contained every sell-off for six weeks.
Tuesday showed what that line means now. XRP opened at $1.10, lifted to $1.11, which is where the underside of the broken rail sits, and was sold straight back down. The low came at $1.03 before price steadied around $1.05 at the time of writing. The $0.99 line is where the whole rally started, and XRP is now within reach of it.
Falling out of a falling channel
This is a different kind of break from the one on November 5. Then, XRP failed above the channel and fell back inside it. Now it has left through the floor, below a boundary that was itself sloping down.
Often a drop like this is more often the last stretch of a sell-off than the start of a new one. The channel already carried the downtrend; falling beneath its lower rail means selling at a pace the trend did not require, and that pace is hard to sustain. It fits the pattern of forced exits rather than fresh positioning.
The flip side is that the rail now works against buyers. For six weeks it was where dips were bought. Tuesday’s rejection at $1.11 shows sellers using it from above, so the $1.08 to $1.11 band is the first thing XRP would need to get back through to put the breakdown behind it.
RSI at 23.13, the lowest on the chart
The 14-day relative strength index reads 23.13, nearly seven points below the 30 mark that signals oversold conditions and 12.24 points under its signal line at 35.37. Nothing on the chart from late July through November comes close: not the September reversal, not the late-October sweep, not the November 5 rejection.
Daily RSI, 0 to 100
■ Signal line 35.37
A reading this far below its own average measures how one-sided four sessions of selling have been. It does not mark a low by itself. Two days ago the same indicator sat at 31.41 and the gap to the signal line was under seven points; both numbers have since moved the wrong way for buyers.
A fifth of the way below the 200-day
All three daily averages are rolling over far above price. The 50-day SMA is at $1.36, the 100-day at $1.31 and the 200-day at $1.27. XRP trades $0.22 below the 200-day, a gap of 17.2%. The further price sits from its long-term average, the more room a reversion bounce has when one arrives. Our view is that the odds of that bounce might improve once the $0.99 to $1.03 zone has been properly tested, not before.
The ladder from $1.70 to $0.90
Overhead
near $1.70 0 Fib, September peak · near $1.53 0.236 · near $1.43 0.382 · near $1.35 to $1.36 0.5 Fib and the 50-day SMA · $1.31 100-day SMA, capped the early-November rebound · near $1.26 to $1.27 0.618 Fib and the 200-day SMA · near $1.14 0.786 Fib, now meets the upper channel rail · $1.08 to $1.11 broken lower rail and Tuesday’s high
Here
$1.03 to $1.05 Tuesday’s low and the current price
Below
near $0.99 to $1.00 1.0 Fib at the August low and the round number · $0.90 to $0.95 early-August consolidation lows
Sweep and snap back, or straight through
XRP’s next daily close could decide whether support near $0.99 brings a rebound or gives way to further losses.
If $0.99 holds: Sellers push XRP under Tuesday’s $1.03 low to test $1.00 and the 1.0 Fib near $0.99, about 5.4% beneath the current price, where buyers defending the August breakout level meet an RSI already at 23.13. A hold anywhere in the $0.99 to $1.03 zone could set up a relief move back to the broken rail at $1.08 to $1.11, roughly 5.6% above today’s close. Only a close back above that band would put XRP inside the channel again and open a test of the 0.786 near $1.14, about 9% higher.
If $0.99 breaks: A bounce that stalls below $1.08 to $1.11, followed by a daily close under the 1.0 Fib near $0.99, would complete a full retracement of the August-to-September rally. That would leave nothing of the structure the rally built.
Tuesday’s leg lower came with the whole market after the October inflation report, the same release that preceded Bitcoin’s dip under $74,000. XRP’s test of its August base is its own, but the timing of the next move may not be: a further fall in Bitcoin could carry XRP through $0.99 regardless of how stretched its RSI is.



Kosta has reported on cryptocurrency markets and blockchain infrastructure since 2020, bringing over six years of hands-on experience in the crypto industry built through daily tracking of markets, trends, and emerging blockchain developments. Specializing in Bitcoin on-chain analysis, institutional ETF flows, and digital asset price action, his work at Coindoo has been cited by other news agencies and consistently covers market developments with a focus on data-driven reporting across Bitcoin, Ethereum, Solana, and XRP. Over the years, Kosta has contributed to multiple crypto media outlets in different regions, authoring over 6,000 articles across the sector. His reporting spans cryptocurrency markets and the broader fintech industry, tracking not only price action but also the technological and regulatory forces shaping the ecosystem. To support his analysis, Kosta actively leverages on-chain data and metrics from leading platforms such as Santiment, Glassnode, and CryptoQuant, enabling deeper, evidence-based market insights. He believes in the power of transparency and the data that underpins the blockchain ecosystem. His academic background in Marketing Management from Denmark further complements his analytical approach, adding a strong understanding of communication strategy and content positioning to his work.