XRP Price Update: Trapped Buyers Sink Toward $1.14

XRP’s breakout above its descending channel did not survive, and four sessions of selling have now carried it to within about a cent of the 0.786 Fibonacci retracement near $1.14.
Key Takeaways
- XRP fell 12.5% after the $1.33 rejection.
- The November 5 close confirmed a bull trap.
- Price stalled just above the 0.786 Fib.
- RSI dropped to 31, near oversold.
Coindoo’s November 5 analysis set the test after XRP was rejected near $1.33: a daily close under the 0.618 level near $1.26 and the 200-day simple moving average (SMA) could confirm a bull trap. On the Binance daily chart at 14:37 UTC on November 8, XRP trades at $1.16, down 0.18% on the day.
Since then, the failed breakout has unwound fast. Buyers who chased XRP above the 200-day were left holding positions below it, and the speed of the drop toward the 0.786 retracement fits those positions being closed. The selling has now started to slow.
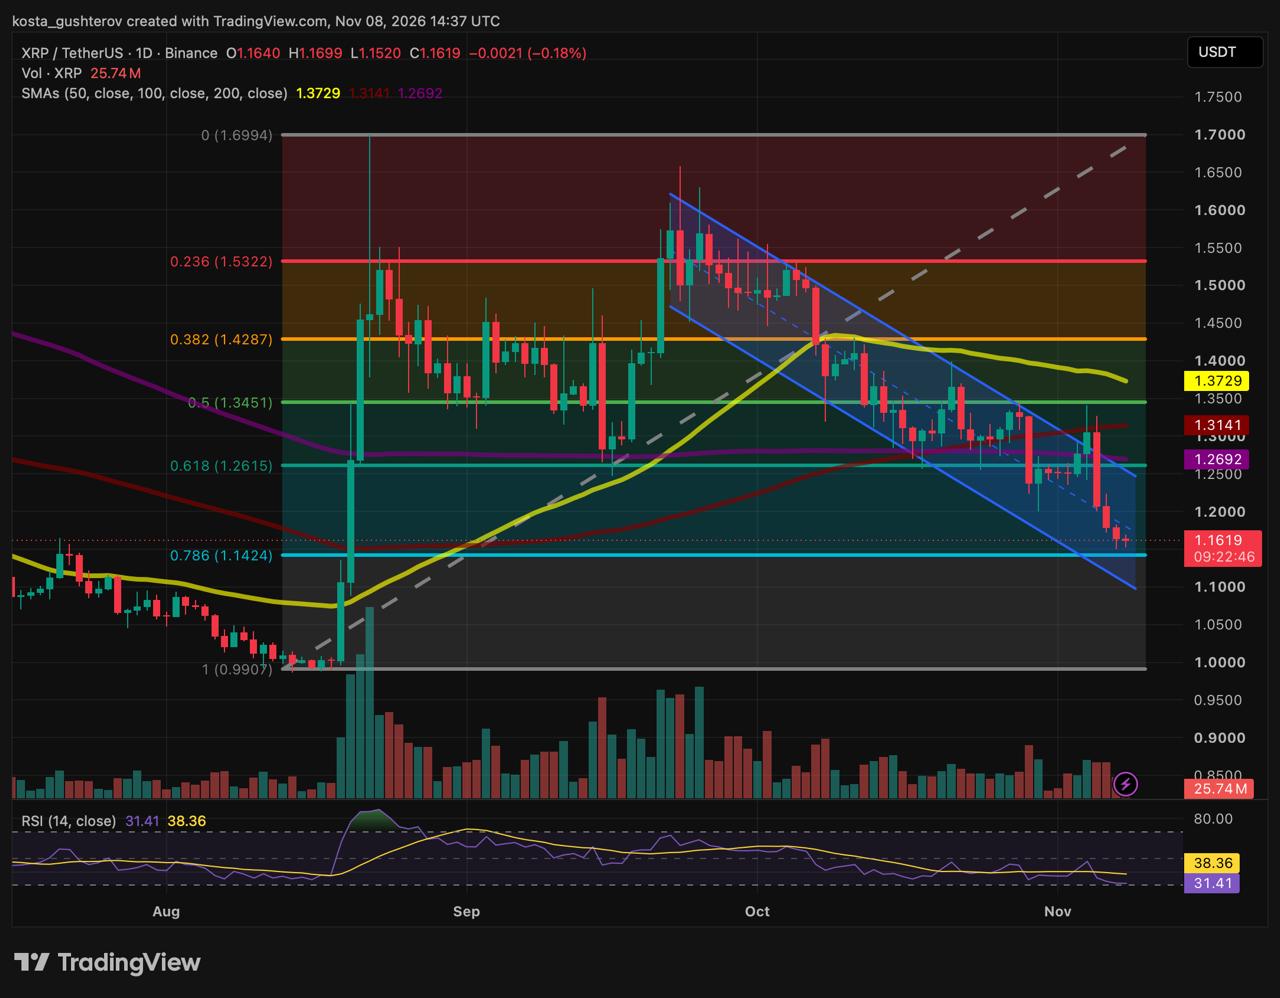
The November 5 close confirmed the trap
The November 4 candle cleared the channel’s upper rail and the 200-day SMA but closed near $1.31, just under the 100-day SMA. On November 5, XRP pushed as high as $1.33 into the 100-day, then reversed. The red candle that followed wiped out the previous day’s gain and closed near $1.21, inside the channel and below both the 0.618 level and the 200-day. The retracement levels are measured from the August low near $0.99 to the late-August high near $1.70.
The reversal itself came during a market-wide unwind, covered in Coindoo’s report on Bitcoin falling under $76.5K, but the slide after it did not. Bitcoin closed near $75,700 on both November 6 and November 7, while XRP gave up about four more cents.
$1.20 went in one session
In late October, XRP dipped to $1.20 intraday and closed well above it. On November 6, the candle opened at that floor, slid to a low around $1.17 and closed near $1.18, below the channel’s midline as well.
In late October, the 200-day SMA and the 0.618 level had only just been lost, and buyers at $1.20 could still bet on a quick return above them. The November 4-5 failure showed that return being sold, which left the floor without the same backing.
Selling slows at the 0.786
The November 5 collapse was followed by a smaller red candle on November 6 and a smaller one again on November 7. Today’s candle, which opened at $1.16, has stayed within a range of under two cents, from $1.15 to $1.17.
Volume from November 5 to 7 held at similar levels on the chart, so any slowdown shows up only in today’s session. By 14:37 UTC, with more than nine hours left, about 25.7 million XRP had traded. On November 5, the count stood near 68.6 million by 16:37 UTC, with roughly seven hours to go.
The 14-day relative strength index (RSI) reads 31.41, just above the 30 oversold mark. It sits 6.95 points under its signal line at 38.36, a gap that has opened from less than a third of a point on November 5 and reflects four days of seller control.

The floor has split in two
On November 5, the 0.786 retracement and the channel’s lower rail sat together near $1.14. The channel, drawn from the late-September highs, has since dropped by about a cent a day, and its lower rail now runs near $1.11. XRP faces two supports roughly three cents apart.
If the selling is a breakout unwind running out of participants, the 0.786 is where that would show first. XRP has not touched it since late August. A daily close above it would support that reading, and the lower rail gives buyers a second line if the first breaks intraday.
The case against calling a low
The slowdown rests partly on a candle that is still open, and a late push could turn its small body into a large one. An RSI near 30 measures how far price has fallen; in a seven-week downtrend it can stay depressed while price grinds along the lower rail. The 50-day SMA is also still falling toward a rising 100-day, with the gap down to under six cents from more than seven on November 5. A cross would undo the crossover that lifted the 50-day above the 100-day around the start of September.
Two paths from the $1.14-$1.17 zone
If the 0.786 holds on a closing basis
A dip under today’s $1.15 low to the 0.786 near $1.14, possibly with RSI briefly under 30, could attract buyers. A daily close back above $1.14 could open the way to $1.20, about 3% above the current price. A broader trend change would need a reclaim of the $1.25-$1.27 cluster, followed by the 100-day near $1.31.
If daily closes slip under $1.14
A close below the 0.786 on rising volume would leave the lower rail near $1.11 as the last line inside the channel. Losing the rail could expose $1.05 and then the 1.0 Fib near $0.99 at the August base, 14-15% below today’s price.
The November 8 and 9 closes are the first read on which path is in play. Bitcoin matters too: a fresh leg lower there could still carry XRP through these levels, whatever its own chart shows.



Kosta has reported on cryptocurrency markets and blockchain infrastructure since 2020, bringing over six years of hands-on experience in the crypto industry built through daily tracking of markets, trends, and emerging blockchain developments. Specializing in Bitcoin on-chain analysis, institutional ETF flows, and digital asset price action, his work at Coindoo has been cited by other news agencies and consistently covers market developments with a focus on data-driven reporting across Bitcoin, Ethereum, Solana, and XRP. Over the years, Kosta has contributed to multiple crypto media outlets in different regions, authoring over 6,000 articles across the sector. His reporting spans cryptocurrency markets and the broader fintech industry, tracking not only price action but also the technological and regulatory forces shaping the ecosystem. To support his analysis, Kosta actively leverages on-chain data and metrics from leading platforms such as Santiment, Glassnode, and CryptoQuant, enabling deeper, evidence-based market insights. He believes in the power of transparency and the data that underpins the blockchain ecosystem. His academic background in Marketing Management from Denmark further complements his analytical approach, adding a strong understanding of communication strategy and content positioning to his work.