Why a Fed Rate Hike Can Push DeFi Yields Lower

Stablecoin lenders on Aave can earn less after an unexpected Fed tightening, because leveraged borrowers repay faster than suppliers withdraw, and the pool’s rate falls with utilization.
Key Takeaways
- Aave yields come from borrowing, not pegs.
- Surprise tightening cuts borrowing faster than supply.
- Lent and borrowed amounts fell roughly 10%.
- Only some lenders can chase Treasury yields.
That is the short-run pattern documented in a working paper published by the Banque de France on November 9, which tracks USDC, USDT and DAI on Aave from January 2021 to January 2026. The authors find that Aave deposit rates drop on impact after a surprise tightening, then drift back over the following months toward a long-run level they cannot distinguish from zero.
The result only makes sense once you see where the interest comes from. An Aave yield is not a reward for holding a dollar token. It is a share of what borrowers pay, and borrowers are mostly funding leveraged bets on bitcoin and ether.
Where an Aave yield comes from
Every reserve on Aave is a pool. Suppliers deposit a stablecoin, borrowers draw from it against crypto collateral, and the share drawn out is the utilization rate. Aave’s rate model charges borrowers more as utilization rises, gently up to a “kink” and steeply beyond it. After a reserve factor is skimmed for the protocol, the rest of that interest flows to suppliers. Supply rate is therefore roughly borrow rate × utilization × (1 − reserve factor).
The paper lists the USDC parameters as of March 2025: a borrow rate that climbs from zero to 4% at the 92% kink, then 10 percentage points steeper above it, with a 10% reserve factor. Run three situations through that curve and the mechanism shows itself.
Starting pool
$10m supplied · $8m borrowed
Utilization 80%
Borrow rate ≈ 3.5%
Supply rate ≈ 2.5%
Borrowers repay half
$10m supplied · $4m borrowed
Utilization 40%
Borrow rate ≈ 1.7%
Supply rate ≈ 0.6%
Both sides halve
$5m supplied · $4m borrowed
Utilization 80%
Borrow rate ≈ 3.5%
Supply rate ≈ 2.5%
Illustrative balances on the USDC curve parameters cited in the paper. Excludes incentives, flash-loan income and compounding; not current Aave quotes.
The middle card is the one the Banque de France team keeps seeing after tightening: borrowing shrinks, supply stays put, and the supplier’s rate loses three quarters of its value. The third card is the reason a shrinking market need not pay less. If suppliers leave at the same pace as borrowers, utilization and the rate do not move at all.
Two forces pull in opposite directions
A Fed surprise reaches the pool from both ends. Borrowers on Aave are overwhelmingly leveraged long on crypto, and the paper finds that bitcoin falls hard and durably after a tightening shock in its sample. Lower expected returns make the leverage less worth paying for, and falling collateral values shrink what constrained borrowers are allowed to owe. Either way they repay, or get liquidated, and utilization drops.
Suppliers have the opposite reaction. Once Treasury bills pay more, lending a stablecoin at 2.5% looks worse, so a lender who can move money back into traditional markets withdraws. That pulls utilization up. It is the same competition for funds that Coindoo described when looking at banks paying savers more, applied inside a lending pool.
Which side wins depends on how many suppliers can actually make that switch. The authors proxy “TradFi-connected” lenders as wallets that only ever touch USDC, never USDT or DAI. Those wallets are about 7% of active liquidity providers and roughly 15% of USDC volume, and after a hike they cut their supplied liquidity by 3-4% more than everyone else. The arbitrage channel exists, in other words, but it runs through a minority of the pool.
What five years of Aave data show
The raw history already points the same way. Between March 2022 and July 2023 the Fed raised rates eleven times, 525 basis points in total, while the average Aave deposit rate went from 2.5% to 0.5% by September 2022 and only recovered to 2.5% by July 2023. The reverse happened in late 2024: the Fed cut by 100 basis points between September and December, and Aave rates jumped from about 3% to 9%. Across narrow windows around hikes, a median 50-basis-point move lifted deposit rates by only about 15 basis points a week later.
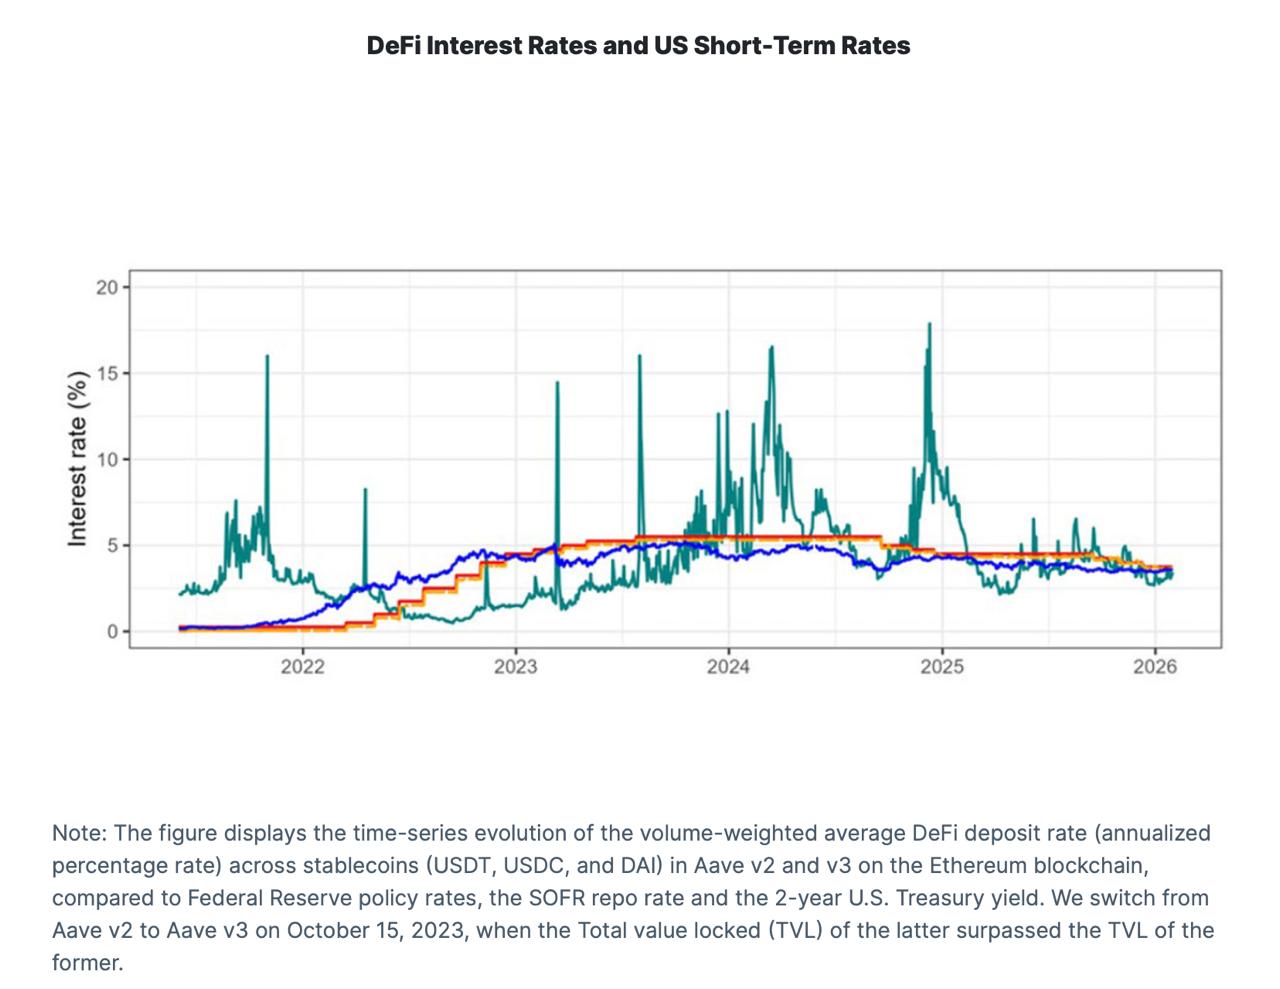
The paper’s main test isolates monetary-policy surprises, measured from interest-rate futures in the half hour around FOMC announcements, and scales each one to a 25-basis-point rise in the two-year Treasury yield. In response to that shock, both total borrowing and total supply fall by around 10% at their peak, four to five months later. Because borrowing falls faster at first, the deposit rate drops immediately for all three stablecoins. It then converges over the year toward a slightly positive level that the authors cannot statistically separate from zero.
Two things follow from the design. The finding describes what happens when markets are surprised, so a widely expected hike should not be read as carrying the same effect. And the paper is signed by Andrea Barbon, Jean Barthélemy and Benoît Nguyen; the full text states that working papers reflect the authors’ views, not the Banque de France’s.
Over longer horizons the pull toward Treasury rates is real but slow. Shocks to the gap between Aave deposit rates and SOFR had a half-life of about five weeks for DAI, four for USDC and just over two for USDT. The gap averaged roughly 100 basis points above the Fed funds rate over the sample, yet sat about 160 basis points below it from mid-2022 to the end of 2023.
How to tell which force is moving a pool
A displayed rate is the output of two quantities, so the quantities are what to read. Pull up total supplied and total borrowed for the same reserve over the same window, and the direction of each tells you what kind of move you are looking at.
Borrowers deleveraging. Liquidity is piling up unused.
New



Kosta has reported on cryptocurrency markets and blockchain infrastructure since 2020, bringing over six years of hands-on experience in the crypto industry built through daily tracking of markets, trends, and emerging blockchain developments. Specializing in Bitcoin on-chain analysis, institutional ETF flows, and digital asset price action, his work at Coindoo has been cited by other news agencies and consistently covers market developments with a focus on data-driven reporting across Bitcoin, Ethereum, Solana, and XRP. Over the years, Kosta has contributed to multiple crypto media outlets in different regions, authoring over 6,000 articles across the sector. His reporting spans cryptocurrency markets and the broader fintech industry, tracking not only price action but also the technological and regulatory forces shaping the ecosystem. To support his analysis, Kosta actively leverages on-chain data and metrics from leading platforms such as Santiment, Glassnode, and CryptoQuant, enabling deeper, evidence-based market insights. He believes in the power of transparency and the data that underpins the blockchain ecosystem. His academic background in Marketing Management from Denmark further complements his analytical approach, adding a strong understanding of communication strategy and content positioning to his work.