Solana Price Keeps Saving $100 at the Last Minute

Solana is leaning on the $100 level, where a Fibonacci retracement meets a round number, with its 100-day average just below and its nearest serious resistance about 9% higher.
Key Takeaways
- 0.382 Fib and round number meet at $100.
- 100-day SMA near $97.7 is the backstop.
- 50-day SMA and 0.236 Fib cluster near $109.5.
- Below $92.3, the 200-day sits near $88.8.
SOL traded around $100.5 on the SOL/USDT daily chart, down about 1.9% on the session after swinging between $99.3 and $102.6.
Why $100 is doing double duty
Solana’s pullback from its $124.7 swing high has brought it back to the 0.382 Fibonacci retracement of the advance from about $59.9, and that level lands at almost exactly $100. A calculated level and a round number in the same place tend to draw more orders than either would alone, which helps explain why recent dips below $100 have ended with daily closes back above it.
Today’s candle has again traded under $100, briefly touching $99.3. It is still open, though, so the intraday bounce says nothing yet about how the day will close.
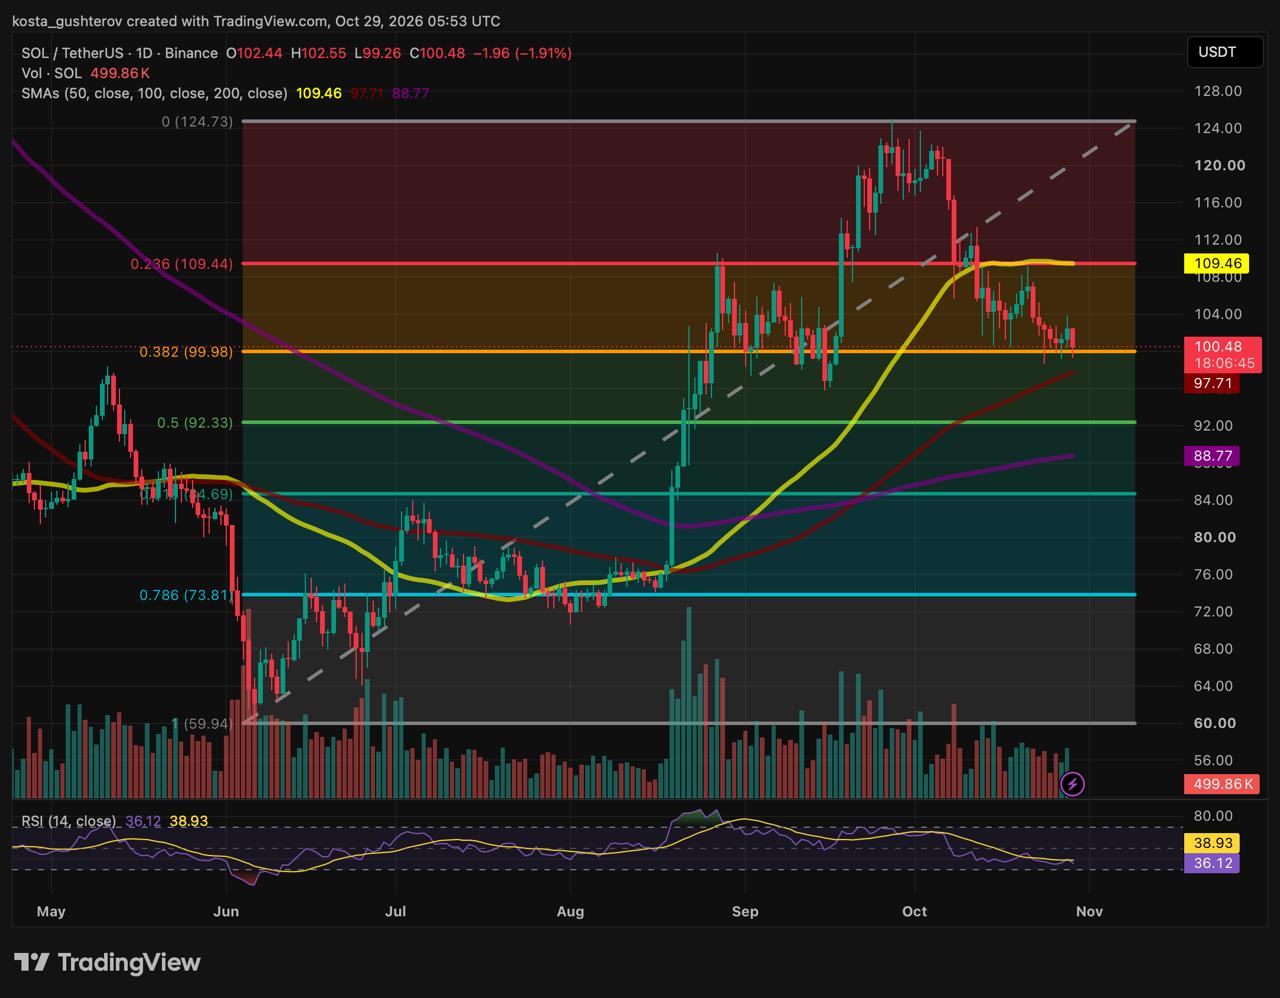
Just under the round number sits a second layer: the rising 100-day simple moving average near $97.7. If $100 gives way for a session, the average is the next thing standing between SOL and a deeper retracement. A daily close beneath it, especially one that buyers fail to reclaim, would take away the backstop that makes the current floor credible.
The setup is lopsided
Measured from $100.5, the levels on either side are not evenly spaced. The bars below show the distance to each one.
Distance from $100.5
$100 · 0.382 Fib −0.5%
$97.7 · 100-day SMA −2.8%
$104 · early recovery threshold +3.5%
$92.3 · 0.5 Fib −8.2%
$109.4–$109.5 · 0.236 Fib + 50-day SMA +8.9%
That imbalance is the core of the chart. A daily close below $97.7 is less than 3% away and would change the read quickly. Undoing the damage of the pullback, by contrast, means getting back through a resistance cluster almost 9% higher. Until one of those happens, SOL is trading in the space between a near floor and a distant ceiling.
Two paths from here
Tap either path to see the levels in order.
Recovery path: $104 → $109.5 → $124.7
- $104 (+3.5%). An early sign of distance from support, with little technical weight of its own.
- $109.4-$109.5 (+8.9%). The 0.236 Fibonacci retracement and the 50-day SMA almost overlap here, making it the main resistance cluster.
- $124.7 (+24%). The previous swing high, a distant reference until the cluster is cleared.
Breakdown path: $97.7 → $92.3 → $88.8 / $84.7
- $100 and $97.7 (-0.5% / -2.8%). The 0.382 Fib and the rising 100-day SMA.
- $92.3 (−8.2%). The 0.5 Fibonacci retracement, a reference point rather than a guaranteed floor.
- $88.8 and $84.7 (-11.6% / -15.7%). The 200-day SMA, then the 0.618 retracement, forming a wider support area.
What a rebound would have to get through
Solana is still below the rising trendline it broke during the pullback and below its 50-day SMA, so even a bounce from $100 starts from a weak position. A move back above $104 would put some distance between price and support, but that level has little technical weight of its own.
The real test sits at $109.4–$109.5, where the 0.236 Fibonacci retracement and the 50-day SMA almost overlap. Two levels that close together tend to attract sellers, and a rebound that stalls there would leave SOL facing another test of $100. A sustained move above the cluster, followed by a pullback that holds on top of it, would be the first sign that the correction has run its course. Only after that would the $124.7 swing high become a realistic reference again.
If the backstop gives way
A daily close beneath the 100-day SMA would turn attention to the 0.5 retracement near $92.3, the next calculated level on the chart. It is a reference point rather than a guaranteed floor.
Below that, two levels form a wider support area: the 200-day SMA near $88.8 and the 0.618 retracement around $84.7. In a continued decline, the 200-day would be the first of the two to come into play.
Where SOL Could Go From $100
Upside: Daily closes holding above $100 and a recovery of $104 could open a move toward the $109.4-$109.5 cluster, where a sustained break and successful retest would be needed before $124.7 comes into view.
Downside: A daily close below $97.7 that buyers fail to reclaim could expose the 0.5 Fib near $92.3, with the 200-day SMA near $88.8 and the 0.618 retracement around $84.7 beneath it.
Bigger picture: Holding $100 would not by itself end the correction. With SOL below its broken trendline and 50-day SMA, the chart only improves meaningfully once the $109.4–$109.5 cluster is cleared.
This article is provided for informational purposes only and does not constitute financial or investment advice. Technical levels and scenarios do not guarantee future price movement.



Kosta has reported on cryptocurrency markets and blockchain infrastructure since 2020, bringing over six years of hands-on experience in the crypto industry built through daily tracking of markets, trends, and emerging blockchain developments. Specializing in Bitcoin on-chain analysis, institutional ETF flows, and digital asset price action, his work at Coindoo has been cited by other news agencies and consistently covers market developments with a focus on data-driven reporting across Bitcoin, Ethereum, Solana, and XRP. Over the years, Kosta has contributed to multiple crypto media outlets in different regions, authoring over 6,000 articles across the sector. His reporting spans cryptocurrency markets and the broader fintech industry, tracking not only price action but also the technological and regulatory forces shaping the ecosystem. To support his analysis, Kosta actively leverages on-chain data and metrics from leading platforms such as Santiment, Glassnode, and CryptoQuant, enabling deeper, evidence-based market insights. He believes in the power of transparency and the data that underpins the blockchain ecosystem. His academic background in Marketing Management from Denmark further complements his analytical approach, adding a strong understanding of communication strategy and content positioning to his work.