Solana Back on Track to $110, but Leverage Could Get in the Way

Solana is again approaching $110, but Hyperliquid open interest has risen far faster than price, leaving the recovery increasingly sensitive to forced liquidations on either side.
Key Takeaways
- SOL is approaching resistance near $110.
- Hyperliquid open interest gained 14.41% in 24h.
- Derivatives volume remains nearly ten times spot.
- A $98.82 loss would weaken recovery.
Derivatives exposure is outpacing SOL’s recovery
At 14:34 UTC on August 30, CoinGlass showed SOL trading at $106.94, up 2.47% over 24 hours. Open interest in Hyperliquid’s SOL market stood at $688.89 million following a 14.41% increase, while rolling volume reached $210.30 million.
Based on that percentage change, the notional value of open contracts had risen from approximately $602.12 million, a difference of about $86.77 million.
That difference does not represent $86.77 million in fresh deposits. SOL’s price increase contributed to the higher dollar value, while open interest counts the contracts that remained unsettled.
HypeBasis, which reads Hyperliquid’s public market data, showed a nearly identical open-interest reading at around the same time.
The $689 million reading does not reveal direction
Open interest measures outstanding participation, not whether traders collectively expect SOL to rise or fall. Every futures contract connects a long with a short, leaving the notional value on both sides matched by construction.
CoinGlass displayed a long/short ratio of 1.1925, pointing to a modest long tilt within that particular measure. It should not be interpreted as a 19.25% imbalance in invested capital because such ratios may count accounts or categories of positions rather than compare their dollar value.
The more relevant risk is how much exposure may be forced out during a sudden price move. Hyperliquid allows up to 20x leverage on its SOL perpetual market, although the available data does not show the average leverage traders are using.
Higher leverage moves a position’s liquidation price closer to its entry. Once liquidations begin, forced market orders can push price into the next cluster of vulnerable positions, accelerating either a decline or a short squeeze.
The wider SOL market is dominated by futures
CoinGlass reported $7.14 billion in aggregate SOL futures open interest, approximately 23% above the $5.81 billion recorded when we examined Solana’s earlier recovery above $94 on August 22.
Hyperliquid accounted for approximately 9.65% of the latest total, making it a significant venue without representing the entire SOL derivatives market.
Aggregate futures volume reached $6.13 billion, compared with $630.02 million in spot turnover. For every dollar of reported spot volume, the derivatives market processed approximately $9.73.
Contracts can change hands repeatedly, while futures are also used for hedging and arbitrage, so the ratio is not a measure of new money. It shows that derivatives are playing a much larger role than spot exchanges in SOL’s short-term price discovery.
Three supports sit below the recent high
The Coinbase daily chart placed SOL near $107, leaving the price just below the recent high and resistance band between $109 and $110. Buyers need a daily close above that area to move the recovery beyond another test of the same ceiling.
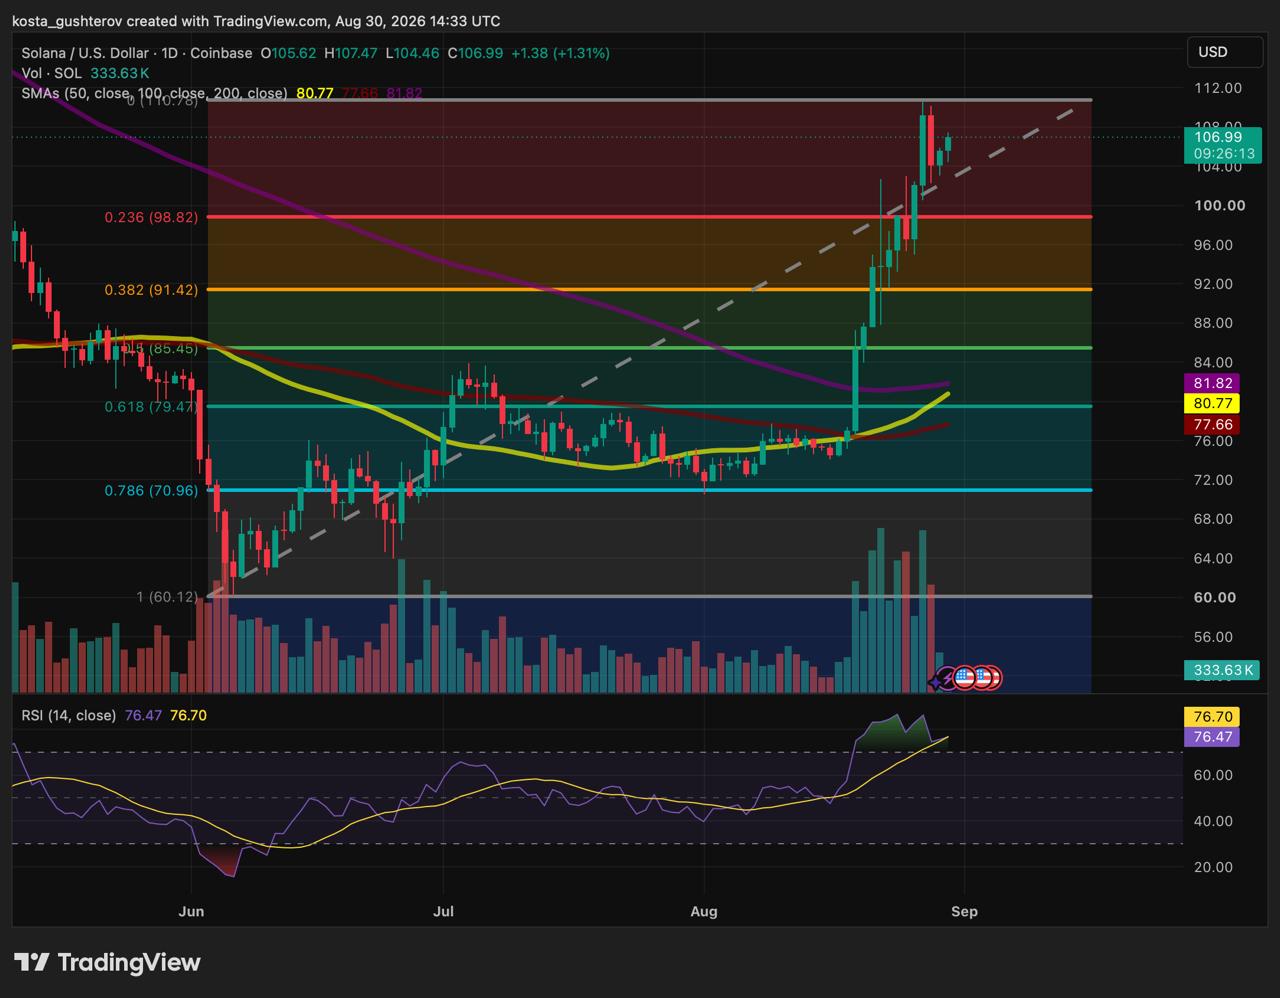
The latest daily low near $104 provides the first indication of whether buyers are defending the move. Below it, the rising trendline around $101-$102 offers a second short-term reference.
The more important support sits near $99. This 0.236 Fibonacci retracement acted as resistance before SOL broke higher, making it the first structural test during a deeper pullback. A daily close beneath it would weaken the breakout and expose the next retracement near $91.42.
Daily RSI stood near 76.5, showing how quickly Solana has travelled through the upper part of the range. That reading is a warning about the rally’s pace, not a sell signal. Price must lose support before the stretched momentum becomes a confirmed breakdown.

Price and open interest must be read together
If buyers clear resistance
A daily close above the recent high would extend the recovery and could force traders positioned for another rejection to cover their shorts.
- Rising price and rising open interest would show traders adding exposure during the breakout. Participation would be increasing, but so would the amount of positioning vulnerable to a reversal.
- Rising price and falling open interest would point toward short covering or broader deleveraging rather than a wave of new contracts.
If structural support fails
A daily close beneath the former breakout level would return SOL to its previous range and shift attention toward the lower retracement.
- Falling price and falling open interest would fit a market in which traders are closing positions or leveraged longs are being liquidated.
- Falling price and rising open interest would show traders adding exposure during the decline, potentially through new shorts, hedges or longs attempting to buy the pullback.
The derivatives build-up does not invalidate SOL’s rebound, but it makes the move less forgiving. Buyers now need price to keep pace with the exposure behind it. A prolonged stall beneath overhead resistance would leave more positions crowded into a narrow area, with the former breakout level separating an ordinary pullback from a broader failure.
Disclaimer: This article is for informational purposes only and does not constitute financial advice. Cryptocurrency and leveraged derivatives trading involve substantial risk.



Alex is Editor-in-Chief of Coindoo and co-founder of Millennial Media Group, with nearly a decade of experience covering financial markets - crypto first, then everything else. It started in 2016 with Bitcoin. Like most people at the time, he didn't fully understand it - so he kept digging. Blockchain, tokenomics, the projects, the cycles. That curiosity never stopped, and eventually pulled him into traditional markets too: equities, commodities, macro. Not because he left crypto behind, but because you can't properly understand one without the other. What drives him is straightforward: he wants to know why something is happening, not just that it's happening. Most market coverage stops at the headline - price up, price down, here's a chart. Alex finds that kind of reporting actively unhelpful. If you walk away from an article without understanding the mechanism behind the move, what did you actually learn? He holds a degree in Tourism from New Bulgarian University - not the most obvious path into financial markets, but markets have a way of pulling in people who are simply too curious to stay out. He has authored over 200 in-depth analyses and more than 10,000 articles across crypto and traditional finance. He still thinks every day in markets teaches him something new. That's probably why he hasn't stopped.