FET Is Back Where the Last Rally Started: The On-Chain Setup Is Different This Time

The mid-March rally that took FET from approximately $0.175 to $0.265 has been fully retraced. Price is at $0.19 at the time of writing on May 21, sitting in the same zone from which that move launched, with the same three moving averages declining above it and the same sub-50 RSI momentum reading.
- FET at $0.1931, retracing to pre-March rally zone after fully giving back the move.
- RSI at 39.47, approaching oversold; SMA100 at $0.2015 is nearest resistance.
- Binance inflow addresses down 92%, netflow down 557% in one week.
- Reserve depleted 20% over 90 days: exchange supply thinner than before the March rally.
- March rally from this zone was fully retraced: same price, structurally different supply.
The chart looks identical to where it stood before the last significant move. The on-chain data does not.
The Chart: Same Level, Deteriorating Momentum
The daily chart places FET below all three moving averages. The SMA100 at $0.2015 is the nearest, sitting $0.0084 above current price. The SMA50 at $0.2179 and SMA200 at $0.2232 have converged near each other, forming a heavier resistance cluster $0.025 and $0.030 above price respectively. All three are declining. RSI at 39.47 with its signal line at 47.17 sits 7.70 points below the signal, confirming negative momentum that has not yet reached the oversold territory below 30 where the March rally’s momentum conditions formed.
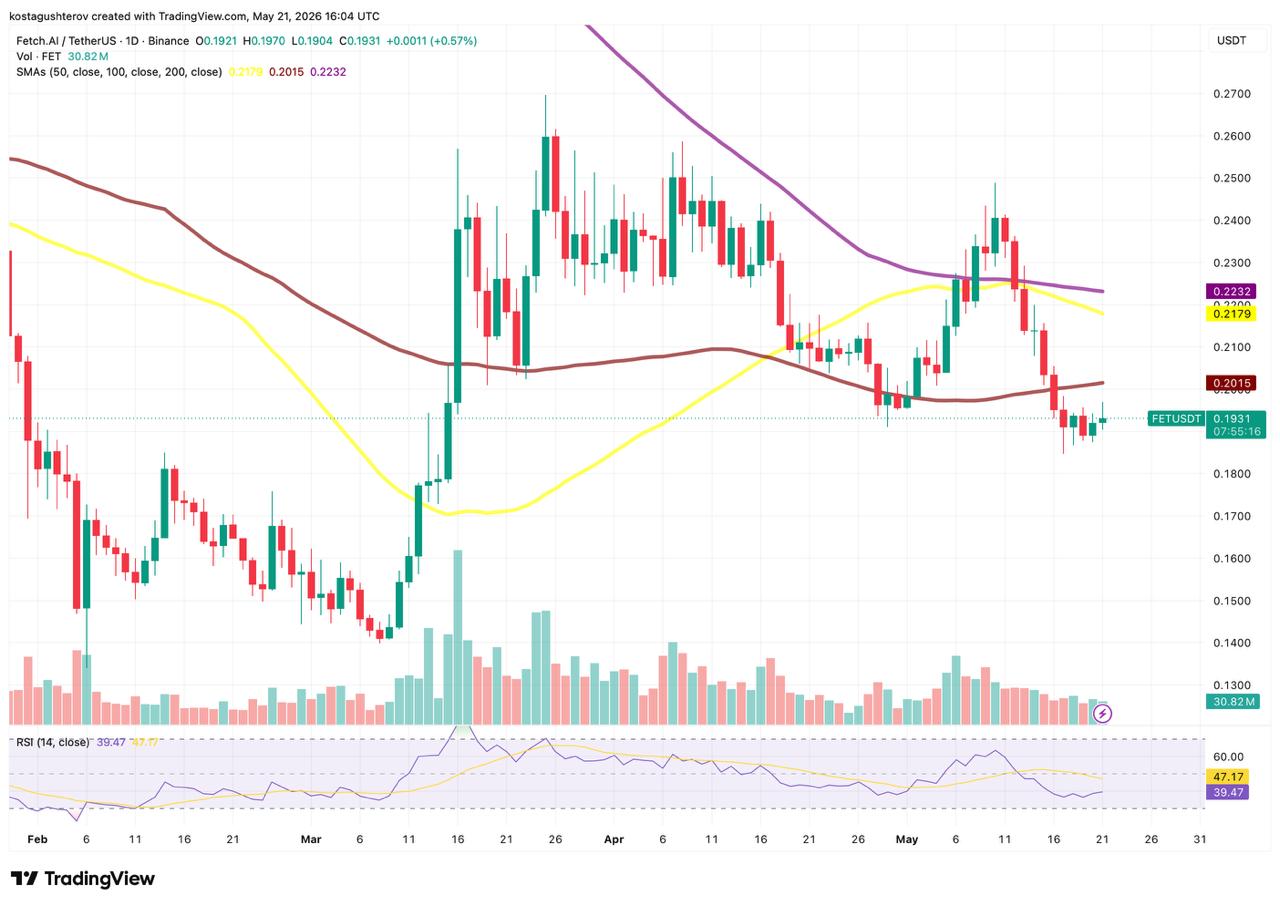
The full retracement of the March move is the chart’s most precise statement: every gain from that rally has been returned, and price has arrived back at the starting level without the RSI having reached the deeply oversold readings that characterized the launch conditions. The momentum setup is worse now than it was then, even though the price is the same.
The On-Chain Layer: What Changed Since March
Before the March rally, Binance’s FET reserve was larger and inflows were active. The situation now is structurally different in one direction. CryptoOnchain’s analysis shows that over the past week, inflow addresses on Binance collapsed 92%, total inflows dropped 71%, and netflow decreased 557%, pushing exchange flows deeply negative. Only 27 inflow addresses are currently active. The 90-day picture adds a second layer: the Binance reserve has depleted 20% over three months, declining from above 340M tokens in late 2025 to approximately 235M currently.
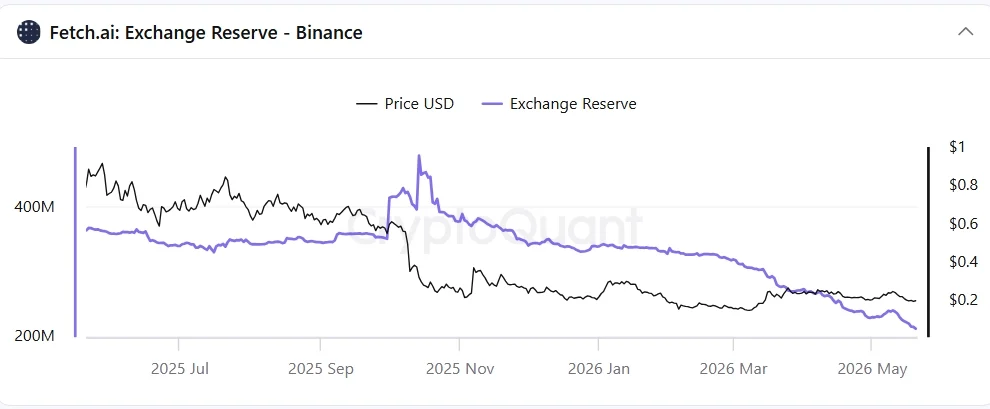
The 20% reserve depletion over 90 days combined with this week’s 71% inflow collapse means the rate at which Binance’s FET reserve shrinks is accelerating even as the absolute reserve becomes smaller, a compounding dynamic that the 90-day average understates. Less exchange supply at the same price level means the selling pressure available to push price lower is structurally reduced compared to March. That is the condition that was absent before the last rally and present now.
A 92% drop in depositing addresses producing a 557% swing in netflow means the inflow drought is not a broad retail exit but the departure of a small number of disproportionately large depositors, and analytically the addresses still depositing are contributing almost nothing to exchange supply given the disproportionate scale of the flow change relative to the headcount reduction.
The tension the two sources produce together is precise and unresolved. Price is at the same level as before the March rally with worse momentum. Exchange supply is thinner than it was then with inflows near zero. The March rally required both conditions to produce its outcome. Currently one has improved and one has deteriorated. A daily close above $0.2015 on expanding volume within the next five sessions with RSI crossing back above its signal line would confirm the supply thinning is producing the demand response the on-chain setup implies. A break below $0.185 with RSI extending toward oversold without a recovery would confirm the momentum deterioration is the dominant condition, and the supply story is not enough on its own.
The information provided in this article is for educational purposes only and does not constitute financial, investment, or trading advice. Coindoo.com does not endorse or recommend any specific investment strategy or cryptocurrency. Always conduct your own research and consult with a licensed financial advisor before making any investment decisions.

Kosta has reported on cryptocurrency markets and blockchain infrastructure since 2020, bringing over six years of hands-on experience in the crypto industry built through daily tracking of markets, trends, and emerging blockchain developments. Specializing in Bitcoin on-chain analysis, institutional ETF flows, and digital asset price action, his work at Coindoo has been cited by other news agencies and consistently covers market developments with a focus on data-driven reporting across Bitcoin, Ethereum, Solana, and XRP. Over the years, Kosta has contributed to multiple crypto media outlets in different regions, authoring over 6,000 articles across the sector. His reporting spans cryptocurrency markets and the broader fintech industry, tracking not only price action but also the technological and regulatory forces shaping the ecosystem. To support his analysis, Kosta actively leverages on-chain data and metrics from leading platforms such as Santiment, Glassnode, and CryptoQuant, enabling deeper, evidence-based market insights. He believes in the power of transparency and the data that underpins the blockchain ecosystem. His academic background in Marketing Management from Denmark further complements his analytical approach, adding a strong understanding of communication strategy and content positioning to his work.