Ethereum Price Holds Steady as Whales Move Into Profit

Ethereum traded near $2,485 after two weeks of narrow price action, while exchange withdrawals, staking and large-holder cost bases created a firmer supply backdrop without confirmed spot demand.
Key Takeaways
- ETH holds near $2,485 inside its range.
- Binance logged $501 million in net ETH outflows.
- 35.24% of the ETH supply is staked.
- ETH trades above three whale realized-price levels.
- Spot buying has not confirmed a breakout.
Ethereum trades near $2,485 inside a 5% range
Ethereum traded around $2,485 on September 8, remaining within the $2,391-$2,514 band identified in a CryptoQuant analysis. The report recorded a September 7 close of $2,489 and found that ETH had remained inside the range for 14 consecutive sessions. The distance between its boundaries was approximately 5%.
The four-hour 50- and 100-period simple moving averages were clustered near $2,465 and $2,466, less than 1% below the market price. That area provides the first short-term test: holding above it would preserve the current position in the upper half of the range, while losing it would leave ETH more exposed to another move toward the lower boundary.
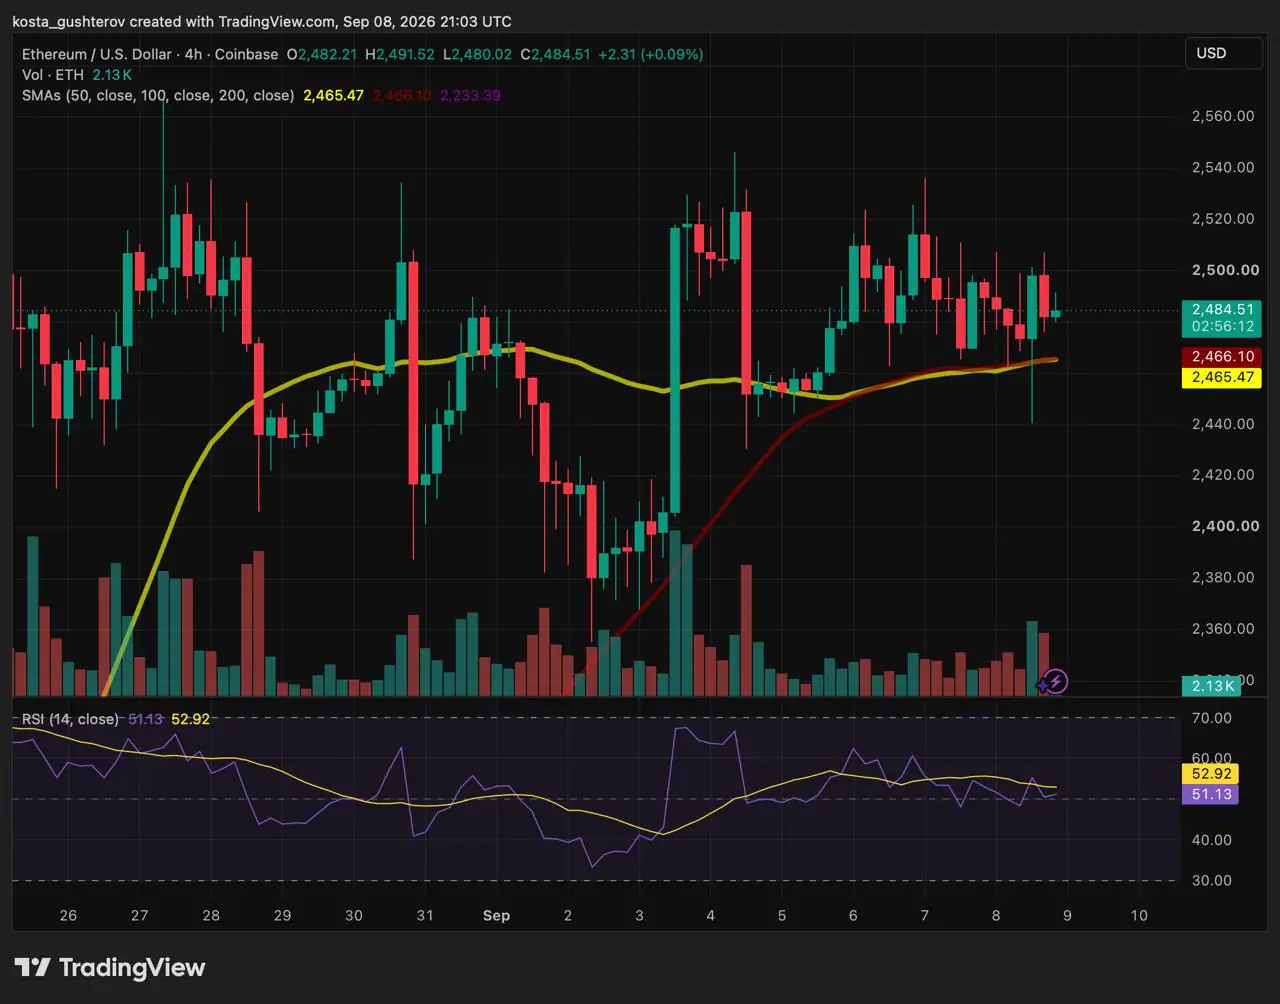
The four-hour RSI was close to 51, showing broadly balanced momentum rather than a strong directional bias. The price compression makes a close outside the range more significant, but neither RSI nor the narrow range predicts which boundary will break first.
Stablecoins arrive as ETH leaves trading venues
Aggregate exchange flows showed an average net outflow of approximately 1,155 ETH per day, with withdrawals exceeding deposits during four of the five latest sessions. When ETH leaves exchange wallets and remains off those venues, less of it is immediately available for trading.
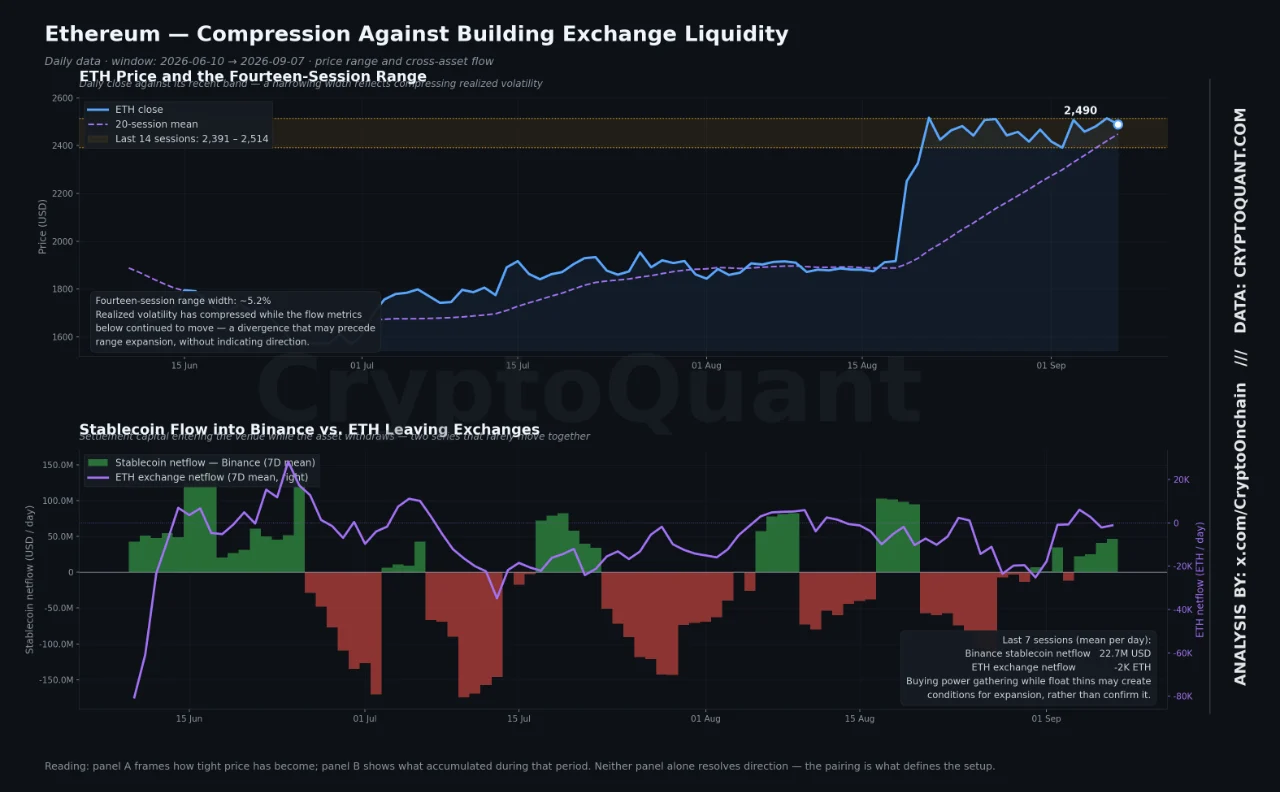
Binance received an average of $46.5 million in daily stablecoin net inflows over the previous week. That was 1,422% above the 30-day baseline and 581% above the quarterly average. The absolute inflow is more useful than those large percentage changes, which were amplified by comparatively low earlier baselines.
The amount of ETH held on exchanges declined while stablecoin liquidity on Binance increased. That favors the supply side, but it does not establish demand. The stablecoins could finance ETH purchases, other cryptocurrency trades, derivatives collateral or transfers between accounts. ETH still needs evidence of direct spot buying.
Binance withdrawals are large, but June is not a template
Binance provides the clearest example of the broader withdrawal trend. A separate CryptoQuant report identified seven negative Binance netflow readings between August 28 and September 8. Approximately $501 million worth of ETH left the exchange on a net basis across those sessions, which were not seven consecutive calendar days.
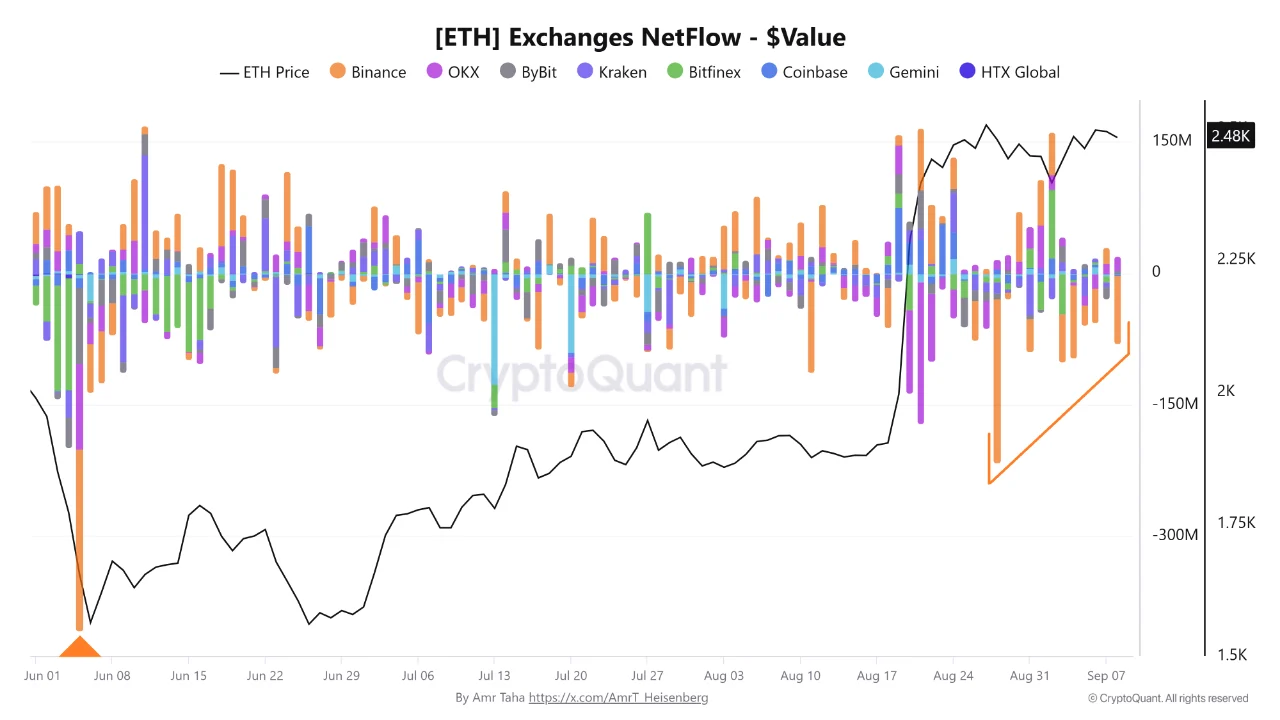
The largest outflow occurred on August 28, when Binance recorded negative ETH netflow of approximately $187 million. That was the exchange’s biggest daily outflow since June 5, when its netflow reached negative $207 million.
On June 5, OKX and Bybit also registered approximately $97 million and $86 million in net withdrawals, respectively. The combined one-day outflow across the three exchanges was close to $390 million. ETH was trading below $1,600 at the time and later advanced by more than 55% toward $2,480.
The comparison goes no further. The June figure covered one day across three exchanges, while the latest $501 million total covers seven readings from Binance alone. The earlier rally also cannot establish that withdrawals caused the price increase or predict a similar result.
The latest withdrawals matter less because they resemble June than because they persisted across seven recent readings. They also extend a longer decline in exchange-accessible supply that continued during Ethereum’s earlier price weakness.
Staking adds another constraint on liquid ETH supply
Exchange withdrawals affect where ETH is held. Staking goes a step further by committing part of the supply to network validation. CryptoQuant’s ETH staking rate reached 35.24%, the highest level in the reported period, after increasing during every session since August 25.
The metric measures the share of total ETH supply held in the staking deposit contract. Combined with exchange outflows, its increase leaves fewer coins positioned for immediate sale. However, staked ETH is not permanently removed: validators can exit, withdrawals are available and liquid-staking tokens allow holders to retain tradable exposure to the underlying assets.

Whale realized prices map the deeper support area
Exchange balances and staking describe how much ETH is readily available; realized prices show where large holders stand relative to the market. Another CryptoQuant analysis examined addresses holding between 100 and 100,000 ETH. Ethereum’s August monthly close finished above the realized prices of all three whale groups included in the report.
The estimated levels were approximately $2,300 for addresses holding 100 to 1,000 ETH, $2,200 for the 1,000-to-10,000 ETH group and $2,100 for holders of 10,000 to 100,000 ETH.
Realized price values coins at the market price when they last moved onchain and divides the resulting realized capitalization by the cohort’s supply. It is an estimated on-chain cost basis, not the exact average price each holder paid.
With ETH near $2,485, the token was trading above the estimated realized price of all three cohorts, placing them in aggregate on-chain profit relative to those levels. This does not show that whales are buying now, and holders in profit may still sell.
If ETH closes below $2,391, the highest whale realized price near $2,300 would become the first cost-basis area to monitor. The deeper cohort levels sit around $2,200 and $2,100. The four-hour 200-period moving average near $2,233 also falls inside that wider band, creating an overlap between the technical and on-chain levels. None of them guarantees support.
Spot buyers have not validated the supply shift
The Coinbase Premium Index was near negative 0.01. The indicator compares Ethereum’s dollar price on Coinbase with its USDT price on Binance. A positive premium means buyers are paying more on Coinbase, while a negative reading places its price slightly below Binance’s.
The premium provides a separate check on US-linked spot demand. It does not reveal whether stablecoins deposited on Binance were used to buy ETH. Its negative reading simply shows that Coinbase was not providing a stronger bid at that point.
Binance funding was positive at approximately 0.01%, meaning long-positioned perpetual traders were paying shorts. The report said the rate had declined by 5.9% over 30 days but remained 62% above its quarterly mean. The positive rate shows a bullish derivatives bias, but funding alone cannot establish how crowded or leveraged the market has become.
A breakout supported by spot volume and a positive Coinbase premium would be less dependent on derivatives. If funding accelerates while spot indicators remain weak, the move would rely more heavily on traders maintaining leveraged positions.
ETH must clear $2,514 to leave the range
At approximately $2,485, ETH remained close to the top of the range but had not broken it. The price was about $29 below the $2,514 upper boundary and approximately $94 above support at $2,391.
A daily close above $2,514 would end the two-week range, but price alone would provide limited confirmation. Rising spot volume, a sustained positive Coinbase premium and continued ETH exchange outflows would show that demand is increasing while exchange-accessible supply remains constrained.
If ETH closes below $2,391, the stronger bearish confirmation would be positive exchange netflows alongside continued weakness in the Coinbase premium. That combination would indicate that coins were returning to trading venues without a compensating improvement in spot demand.
Until spot demand confirms either direction, the on-chain data explains the pressure around Ethereum’s range but does not determine how it will break.
This article is for informational purposes only and does not constitute financial advice.



Kosta has reported on cryptocurrency markets and blockchain infrastructure since 2020, bringing over six years of hands-on experience in the crypto industry built through daily tracking of markets, trends, and emerging blockchain developments. Specializing in Bitcoin on-chain analysis, institutional ETF flows, and digital asset price action, his work at Coindoo has been cited by other news agencies and consistently covers market developments with a focus on data-driven reporting across Bitcoin, Ethereum, Solana, and XRP. Over the years, Kosta has contributed to multiple crypto media outlets in different regions, authoring over 6,000 articles across the sector. His reporting spans cryptocurrency markets and the broader fintech industry, tracking not only price action but also the technological and regulatory forces shaping the ecosystem. To support his analysis, Kosta actively leverages on-chain data and metrics from leading platforms such as Santiment, Glassnode, and CryptoQuant, enabling deeper, evidence-based market insights. He believes in the power of transparency and the data that underpins the blockchain ecosystem. His academic background in Marketing Management from Denmark further complements his analytical approach, adding a strong understanding of communication strategy and content positioning to his work.