ETH Breaks a Year-Long Trendline – Key Weekly Levels

Ethereum has finally pushed above the descending trendline that capped its price action for nearly a year. While the move clears a major hurdle, buyers still need to defend reclaimed territory into the weekly close to confirm a true breakout.
Key Takeaways
- ETH has cleared its primary weekly downtrend line.
- $2,300 must hold on a closing basis to validate the move.
- The 50-week simple moving average sits directly overhead near $2,580.
- Clearing $2,580 opens the path toward the $2,800 Fibonacci level.
- Weekly RSI has reclaimed neutral territory above 50 without flashing overbought conditions.
Ethereum clears a trendline that capped every rally since late 2025
Ethereum spent nearly twelve months locked beneath a downward trendline extending from its $4,950 peak. Every recovery attempt along the way stalled out at or below that falling ceiling.
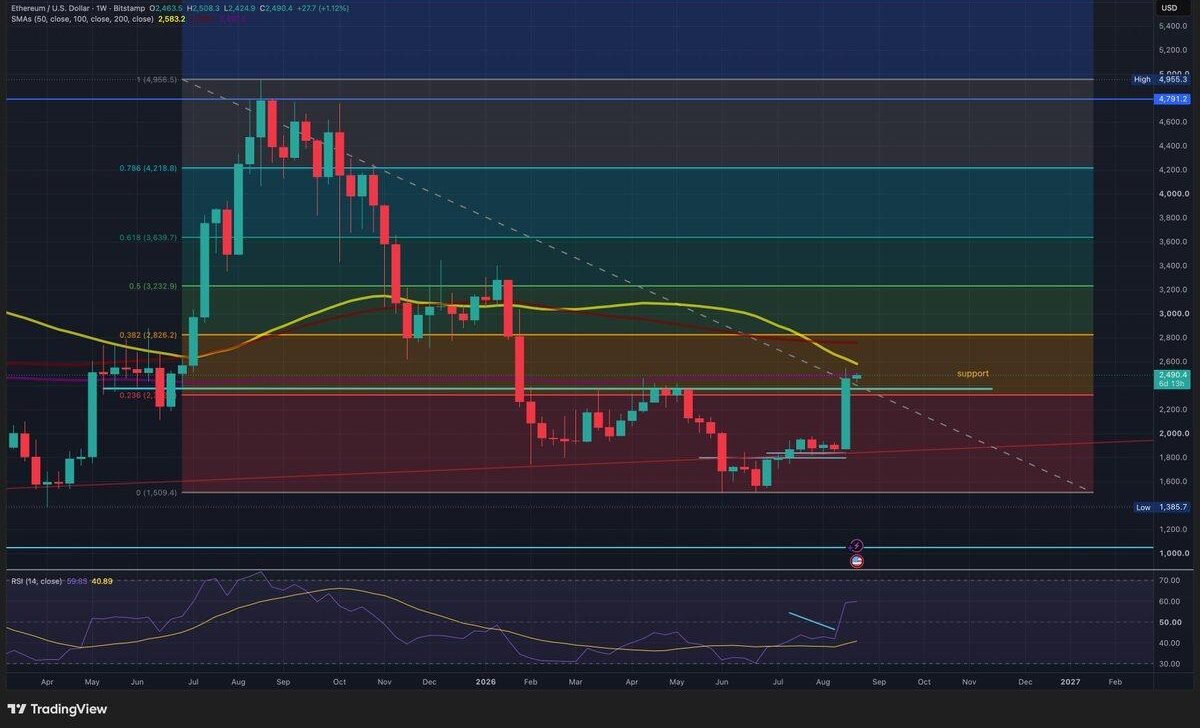
This week’s surge from $1,900 to ~$2,500 pushed price decisively outside the pattern, also taking out the 0.236 Fibonacci retracement of the broader drop. It marks the first structural shift on the weekly chart in months.
However, intra-week spikes carry little weight without confirmation. A breakout requires acceptance, and buyers must hold these gains through the weekend to prevent a false breakout.
Why $2,300 is the immediate line in the sand
The 0.236 Fibonacci retracement near $2,300 has flipped from overhead resistance into primary structural support.
Holding above $2,300 at the close confirms that the market is willing to absorb supply above the first major retracement level. A slip back below wouldn’t entirely destroy the multi-week rebound, but it would drop price back under the broken trendline and risk turning this push into another bull trap.
Intraday wicks can test deeper, but the closing print will determine whether $2,300 becomes a reliable floor.
$2,580 stands between ETH and the $2,800 Fib target
Even with the trendline behind it, ETH faces stiff overhead resistance near $2,580, where the 50-week moving average currently rests. This indicator regularly acts as a trend pivot on higher timeframes.
If ETH clears the 50-week average, the next major objective sits at $2,800 the 0.382 Fibonacci retracement. This area aligns with significant structural consolidation from earlier in the cycle.
Until ETH secures $2,300 as support and breaks past $2,580, higher targets remain speculative.

Weekly momentum shifts back to buyers
Weekly RSI has climbed to roughly 60, recovering sharply from near-oversold conditions in June. Reclaiming the neutral 50 threshold indicates sustained buying pressure across larger timeframes rather than a simple low-volume bounce.
An RSI reading near 60 leaves plenty of runway before reaching overbought territory (70+). Bearish momentum divergence isn’t a factor yet, giving bulls room to stretch this move higher if overhead levels break.
The invalidated setup: What breaks the bullish thesis?
Bulls don’t need to defend every intraday dip, but they must protect the key breakout zone. A weekly close back inside the old channel below $2,300 would invalidate the breakout and threaten a retracement toward the $2,000 demand block.
While the June low of $1,500 remains the ultimate macro floor, the immediate focus stays on $2,300. The chart has structurally improved, but building a multi-month reversal starts with holding newly won ground.
This article is provided for informational purposes only and does not constitute investment advice.



Alex is Editor-in-Chief of Coindoo and co-founder of Millennial Media Group, with nearly a decade of experience covering financial markets - crypto first, then everything else. It started in 2016 with Bitcoin. Like most people at the time, he didn't fully understand it - so he kept digging. Blockchain, tokenomics, the projects, the cycles. That curiosity never stopped, and eventually pulled him into traditional markets too: equities, commodities, macro. Not because he left crypto behind, but because you can't properly understand one without the other. What drives him is straightforward: he wants to know why something is happening, not just that it's happening. Most market coverage stops at the headline - price up, price down, here's a chart. Alex finds that kind of reporting actively unhelpful. If you walk away from an article without understanding the mechanism behind the move, what did you actually learn? He holds a degree in Tourism from New Bulgarian University - not the most obvious path into financial markets, but markets have a way of pulling in people who are simply too curious to stay out. He has authored over 200 in-depth analyses and more than 10,000 articles across crypto and traditional finance. He still thinks every day in markets teaches him something new. That's probably why he hasn't stopped.