Cardano Price Analysis: ADA Fights to Hold Above $0.26

Cardano moved above $0.26 and approached $0.28, but the next signal will come from whether buyers can defend the reclaimed $0.254-$0.260 zone in coming sessions.
Key Takeaways
- ADA reached $0.27655 after recovering from a pullback near $0.24.
- The reclaimed $0.254-$0.260 area is now the first support test.
- $0.238-$0.247 is the stronger nearby support zone if the breakout cools.
- RSI near 69 shows strong momentum approaching an extended reading.
The $0.24 pullback created a higher low
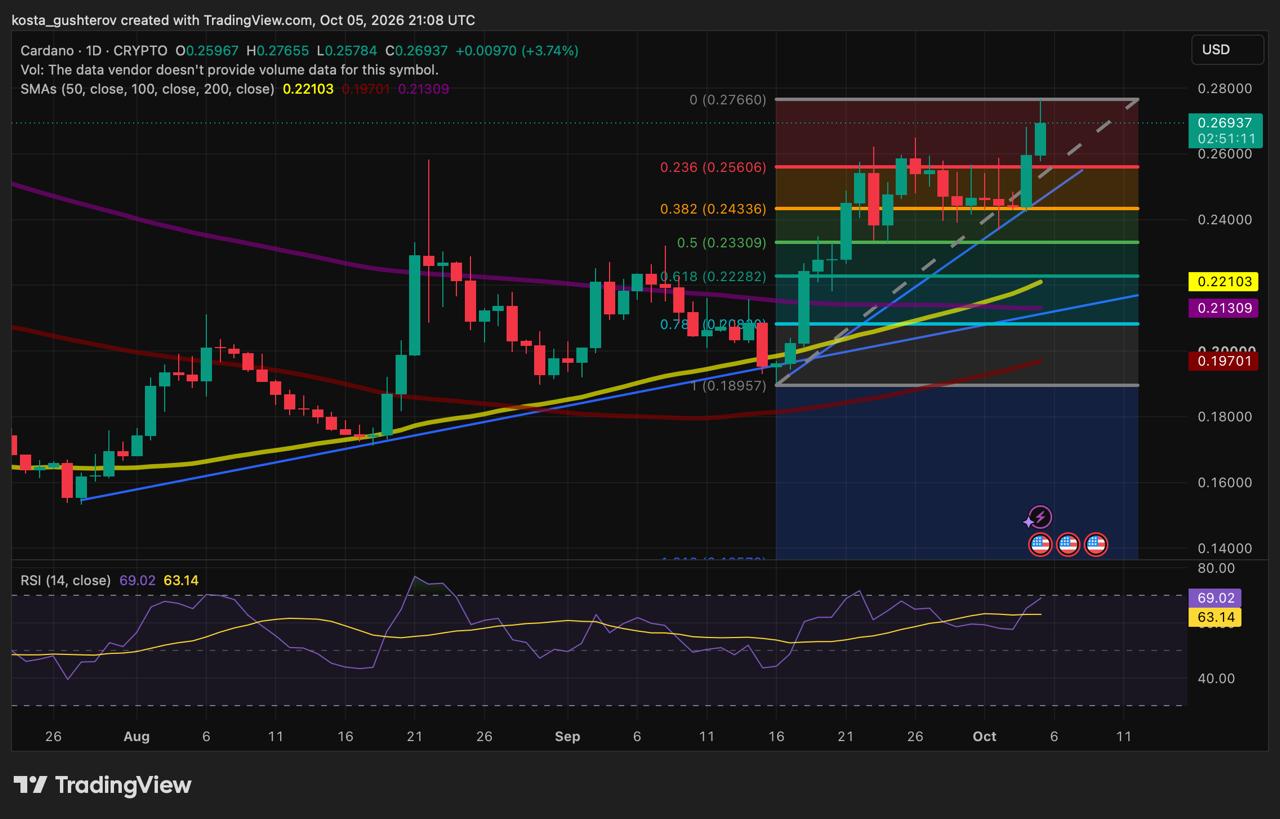
ADA traded near $0.269 at 21:08 UTC on October 5 after reaching $0.276 on the daily chart. Before that advance, a pullback found buyers near $0.24, leaving a higher low above September’s swing bottom around $0.189.
That recovery from $0.24 gave ADA another attempt at the $0.255-$0.260 area, where several recent candle bodies had stalled. Price has now moved through that ceiling, although the daily candle was still open at the chart’s timestamp.
That makes the former ceiling the chart’s immediate point of pressure. Buyers have moved through it; their next task is to keep ADA from settling back below it.
ADA now has to hold the ground it gained above $0.26
The $0.254-$0.260 area formed the upper edge of ADA’s recent consolidation. Crossing it placed price above the range that had repeatedly held back the recovery.
The 0.236 Fibonacci retracement at $0.256 sits within the same area. The steeper rising blue trendline also approaches the zone, while the latest daily candle found intraday support near $0.257.
A pullback toward this range would show whether the sellers who capped ADA near $0.26 have been replaced by buyers. That support-resistance reversal is one of the signals traders use to judge whether a breakout is settling into place, as Fidelity explains.
What could strengthen the move?
A daily close above $0.254-$0.260, followed by a pullback that holds within the zone and leads to another rebound, would show buyers defending the ground gained during the latest advance.
A brief wick below the range would carry less weight than repeated daily closes beneath it, particularly if later rebounds fail to regain the former ceiling.
Below $0.26, the chart groups support into wider areas
A failed retest would weaken the immediate breakout, yet ADA would still have room to preserve the recovery. The chart groups the deeper references into zones where Fibonacci levels, earlier price reactions, moving averages and rising trendlines overlap.
- $0.238-$0.247
- The 0.382 Fibonacci level at $0.243 and repeated recent pullback reactions make this the strongest nearby support area.
- $0.220-$0.224
- The 0.618 retracement at $0.222 overlaps the 50-day SMA near $0.221.
- $0.208-$0.218
- The 0.786 retracement near $0.208, the 200-day SMA at $0.21309 and the broader rising trendline create a wider structural pocket.
- $0.189-$0.200
- September’s $0.189 swing low, the 100-day SMA near $0.197 and an earlier rebound area form the broader fallback zone.
Fibonacci levels use the chart’s move from the September low near $0.18957 to the current high near $0.27660. A higher high would change the retracement values.
Losing $0.254-$0.260 would weaken the immediate breakout, yet ADA could still keep its recent higher-low structure intact by holding the $0.238-$0.247 area. That zone contains the 0.382 retracement and the pullback reactions that built the base for the latest move.
Trading beneath it for several sessions would shift attention toward the $0.220-$0.224 and $0.208-$0.218 pockets. A break below $0.189-$0.200 would carry greater weight because it would undercut the September low and the wider recovery structure.
$0.274-$0.280 is the immediate upside hurdle
Holding the reclaimed range would bring the latest wick high at $0.276 and the round $0.28 level back into focus. A close through that area followed by sustained trading above it would show that buying interest continued after the initial break above $0.26.
Whether ADA clears that hurdle will depend partly on whether momentum can keep pace with price. The 14-day relative strength index stood near 69.02, above its smoothing line at 63.14.
Readings near or above 70 are commonly described as overbought because they reflect a strong recent advance. As Fidelity’s RSI guide notes, the indicator can remain elevated while a trend continues. A rejection near $0.28 would therefore matter most through its effect on the support areas below.
ADA’s next daily closes could show whether the move has created support or only produced a brief push above resistance. Staying above $0.254-$0.260 may keep $0.274-$0.280 in play; a sustained loss of $0.238-$0.247 probably will move the recovery into a deeper test.
Chart source: TradingView, ADA/USD daily chart, October 5, 2026, at 21:08 UTC. This article is for informational purposes only and does not constitute investment advice. Technical levels are approximate and do not guarantee future price movements.



Kosta has reported on cryptocurrency markets and blockchain infrastructure since 2020, bringing over six years of hands-on experience in the crypto industry built through daily tracking of markets, trends, and emerging blockchain developments. Specializing in Bitcoin on-chain analysis, institutional ETF flows, and digital asset price action, his work at Coindoo has been cited by other news agencies and consistently covers market developments with a focus on data-driven reporting across Bitcoin, Ethereum, Solana, and XRP. Over the years, Kosta has contributed to multiple crypto media outlets in different regions, authoring over 6,000 articles across the sector. His reporting spans cryptocurrency markets and the broader fintech industry, tracking not only price action but also the technological and regulatory forces shaping the ecosystem. To support his analysis, Kosta actively leverages on-chain data and metrics from leading platforms such as Santiment, Glassnode, and CryptoQuant, enabling deeper, evidence-based market insights. He believes in the power of transparency and the data that underpins the blockchain ecosystem. His academic background in Marketing Management from Denmark further complements his analytical approach, adding a strong understanding of communication strategy and content positioning to his work.