Bitcoin’s Worst Week of 2026: What the COT Report Reveals About the Crash

Bitcoin posts its worst week of 2026 as institutional outflows, mass liquidations and capital rotation toward AI stocks hit the market simultaneously.
Key Takeaways
- BTC dropped 17.69% for the week, hitting a low of $59,128
- Spot ETFs recorded a historic $3.4 billion in net outflows in a single week, with 13 consecutive days of red flows.
- Bitcoin’s realized capitalization shrank by approximately $40 billion.
- The 200-week moving average was briefly pierced but closed above.
Crypto markets are going through one of their worst stretches of 2026. Bitcoin lost more than 17% of its value in just five trading sessions, opening the week at $73,680, briefly touching $73,889, and then collapsing to $59,128 before closing at $60,462 – a range that tells the story of a market that ran out of buyers fast. Months of accumulated gains were erased in days, and the selling pressure came from multiple directions at once: institutional funds pulling capital, leveraged positions being forcibly closed, and a macro environment actively pulling money away from crypto toward other assets. This is a market searching for a bottom it has not yet found.
What the COT data showed – and what it missed
The CFTC’s weekly COT report, published June 2 with data through May 27, showed non-commercial participants – hedge funds and speculators – holding a net long position of +2,458 contracts at prices around $66,700, with 17,210 longs against 14,752 shorts. That is a ratio of roughly 1.17 longs for every short – moderately bullish in absolute terms, but far from the one-sided positioning that typically precedes a strong directional move. The report also logged 1,335 spread positions – contracts held simultaneously long and short in different delivery months, which count toward open interest but represent neither a bullish nor bearish bet. The historical data in the same report tells a different story.
Over the entire measured history of this contract, non-commercial traders have accumulated a total of 1,059,435 long contracts against 1,050,798 short contracts – a difference of less than 1%. That near-parity over the long run means the current net long reading of +2,458 is not a strong structural signal in either direction. It simply means speculators are slightly more bullish than bearish right now, not that there is deep conviction behind the positioning.
What is more telling is the divergence visible in the net positions chart. Non-commercial net longs have been climbing steadily since December, reaching near yearly highs – while the price of Bitcoin has fallen roughly 44% from its October 2025 peak near $125,000. Speculators have been accumulating longs into a falling market, which can mean two things: either they are right and a recovery is coming, or those longs become forced selling when levels break. Last week, it was the latter.
Open interest had already fallen by 1,743 contracts in the week covered by the report – a sign of capital leaving the market that in retrospect reads as a warning. Falling open interest alongside falling price signals the market is deleveraging rather than building new short positions – which is less bearish structurally than it appears, but still confirms that participants were exiting rather than committing capital in either direction.
Commercial traders, who typically use futures to hedge rather than speculate, held 2,779 short contracts against just 184 longs – an almost entirely one-sided positioning that has been their consistent stance throughout this period.
| Category | Long | Short | Spreads | Net |
|---|---|---|---|---|
| Non-Commercial | 17,210 | 14,752 | 1,335 | +2,458 |
| Commercial | 184 | 2,779 | – | -2,595 |
| Non-Reportable | 1,153 | 1,016 | – | +137 |
| Total Open Interest | 18,729 | 18,866 | – | 19,882 |
The non-reportable category – small retail traders below CFTC reporting thresholds – sits at a net +137, essentially neutral and too small to move the market in either direction.
The report covers Bitcoin futures on the CME – Coinbase Derivatives LLC files separately, though CME remains the dominant venue.
The institutional exit runs deeper than the futures market
The true scale of institutional withdrawal is visible not in futures but in spot ETF flows. By June 3, the funds had suffered 13 consecutive days of net outflows, shrinking total assets from $104 billion to $82.8 billion in under three weeks, according to data from Farside Investors.
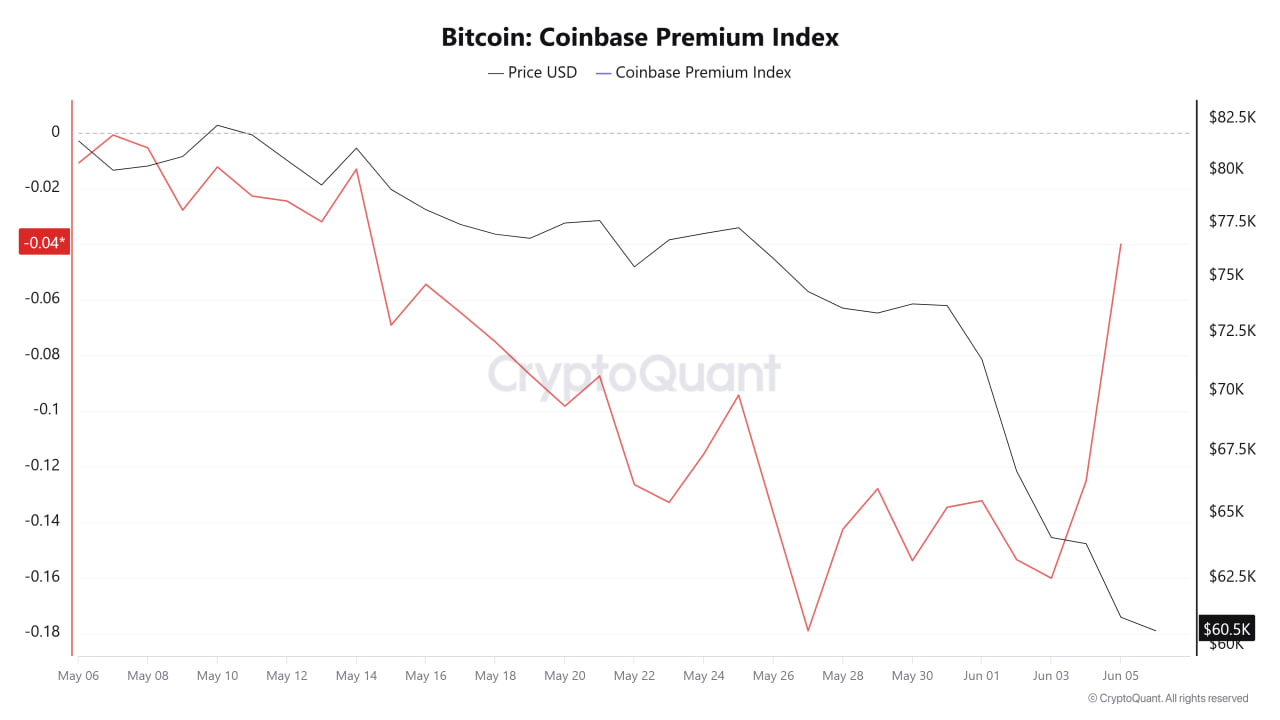
Even BlackRock’s IBIT – historically more resilient during corrections – recorded its worst week on record. The Coinbase Premium Index fell to -0.15% around June 2-3, meaning US institutional buyers were paying less for BTC than offshore markets – effectively confirming that demand from that side had dried up entirely.
On-chain data from CryptoQuant fills in the rest of the picture. Bitcoin’s realized capitalization fell from $1.12 trillion to $1.08 trillion, reflecting roughly $40 billion in real capital leaving the network rather than simply moving between wallets.
Liquidations amplified the move
The drop was accelerated by forced closures of leveraged positions. Between June 2 and 5, total crypto derivatives liquidations reached between $1.6 billion and $1.8 billion in under 48 hours, with long positions – traders who had bet on a price increase – taking the bulk of the hit.
That cascade of forced selling explains why the move was so sharp relative to what looked like ordinary volume at the start of the week. The longs built between $66,000 and $70,000, which the COT data had flagged as the dominant positioning, became additional selling pressure as those positions were closed at a loss.

Strategy sold – but Saylor is not walking away
An additional negative catalyst arrived on June 1, when Strategy disclosed in a regulatory filing that it had sold a small portion of its Bitcoin holdings for the first time since 2022. The news rattled the market, but context matters – the sale is marginal relative to the company’s total holdings and does not signal any shift in Michael Saylor’s long-term conviction.
The AI buildout is absorbing capital at historic scale, creating temporary pressure across global markets. That does not weaken Bitcoin. It strengthens the case for scarce, liquid, digital capital. Bitcoin remains the premier asset for the long term. $BTC pic.twitter.com/DMXidrHDB8
— Michael Saylor (@saylor) June 6, 2026
Strategy remains the world’s largest corporate Bitcoin holder and has given no indication of stepping back from that position. Blaming this transaction for the broader selloff would mean ignoring far larger movements in ETF flows and the derivatives market that were already underway.
What the chart is saying
The weekly candle closed at $60,462 after briefly testing $59,128 – a zone that coincides with the 200-week moving average, currently at $61,823. The 50-week SMA sits at $92,561 and the 100-week at $88,377, which frames the scale of the correction from October’s highs.
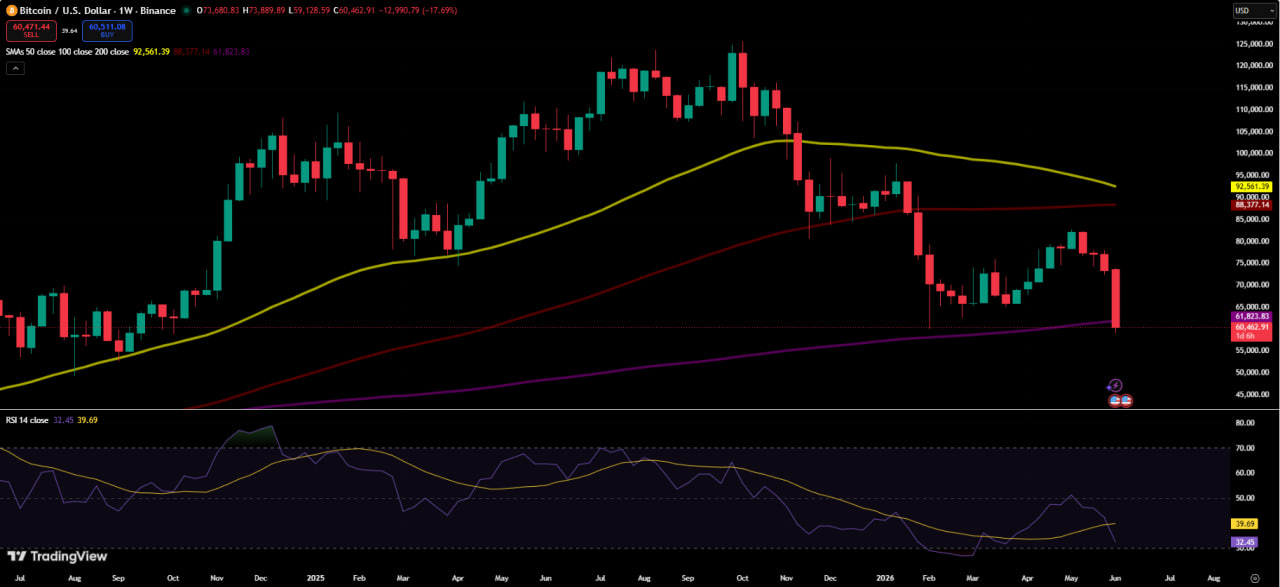
The weekly RSI has fallen to 32.45 – deep in oversold territory, at levels where Bitcoin has historically found at least short-term support. If buyers fail to hold the $59,000-$60,000 range, the next meaningful support zone sits around $52,000-$55,000. A stabilization at current levels would put a recovery toward $66,000-$70,000 within reach ahead of the next major macro catalyst.
The broader selloff and the capital rotation story
Bitcoin did not fall alone. On Friday, US, European and Asian equity markets all registered significant losses, while gold and oil also corrected – a simultaneous risk-off move across virtually every asset class. The underlying dynamic, however, is not just fear.
A large and growing portion of institutional capital is actively rotating toward the AI sector, where valuations continue climbing alongside record highs in US indices. The anticipated SpaceX IPO is absorbing additional liquidity that might otherwise have supported crypto markets. Crypto is not simply losing to fear – it is losing to competition for capital from assets that are currently generating stronger momentum. The next key dates are the CPI inflation reading on June 10, PPI data on June 11, and the Federal Reserve decision on June 17, with markets currently pricing over a 70% probability of a rate hike given May’s strong labor market figures.
The information provided in this article is for educational purposes only and does not constitute financial, investment, or trading advice. Coindoo.com does not endorse or recommend any specific investment strategy or cryptocurrency. Always conduct your own research and consult with a licensed financial advisor before making any investment decisions.


Alex is Editor-in-Chief of Coindoo and co-founder of Millennial Media Group, with nearly a decade of experience covering financial markets - crypto first, then everything else. It started in 2016 with Bitcoin. Like most people at the time, he didn't fully understand it - so he kept digging. Blockchain, tokenomics, the projects, the cycles. That curiosity never stopped, and eventually pulled him into traditional markets too: equities, commodities, macro. Not because he left crypto behind, but because you can't properly understand one without the other. What drives him is straightforward: he wants to know why something is happening, not just that it's happening. Most market coverage stops at the headline - price up, price down, here's a chart. Alex finds that kind of reporting actively unhelpful. If you walk away from an article without understanding the mechanism behind the move, what did you actually learn? He holds a degree in Tourism from New Bulgarian University - not the most obvious path into financial markets, but markets have a way of pulling in people who are simply too curious to stay out. He has authored over 200 in-depth analyses and more than 10,000 articles across crypto and traditional finance. He still thinks every day in markets teaches him something new. That's probably why he hasn't stopped.