Bitcoin’s Missing Retail and What the Binance Data Shows

Bitcoin looks short of retail traders and Binance futures exposure has shrunk, but both readings followed a record exchange hack, and measured in coins, futures positioning barely moved.
Key Takeaways
- Binance lost about $6.3 billion on October 29.
- Binance BTC open interest fell to $8.7 billion.
- Measured in BTC, that exposure barely changed.
- Spot ETFs shed $399 million on November 2.
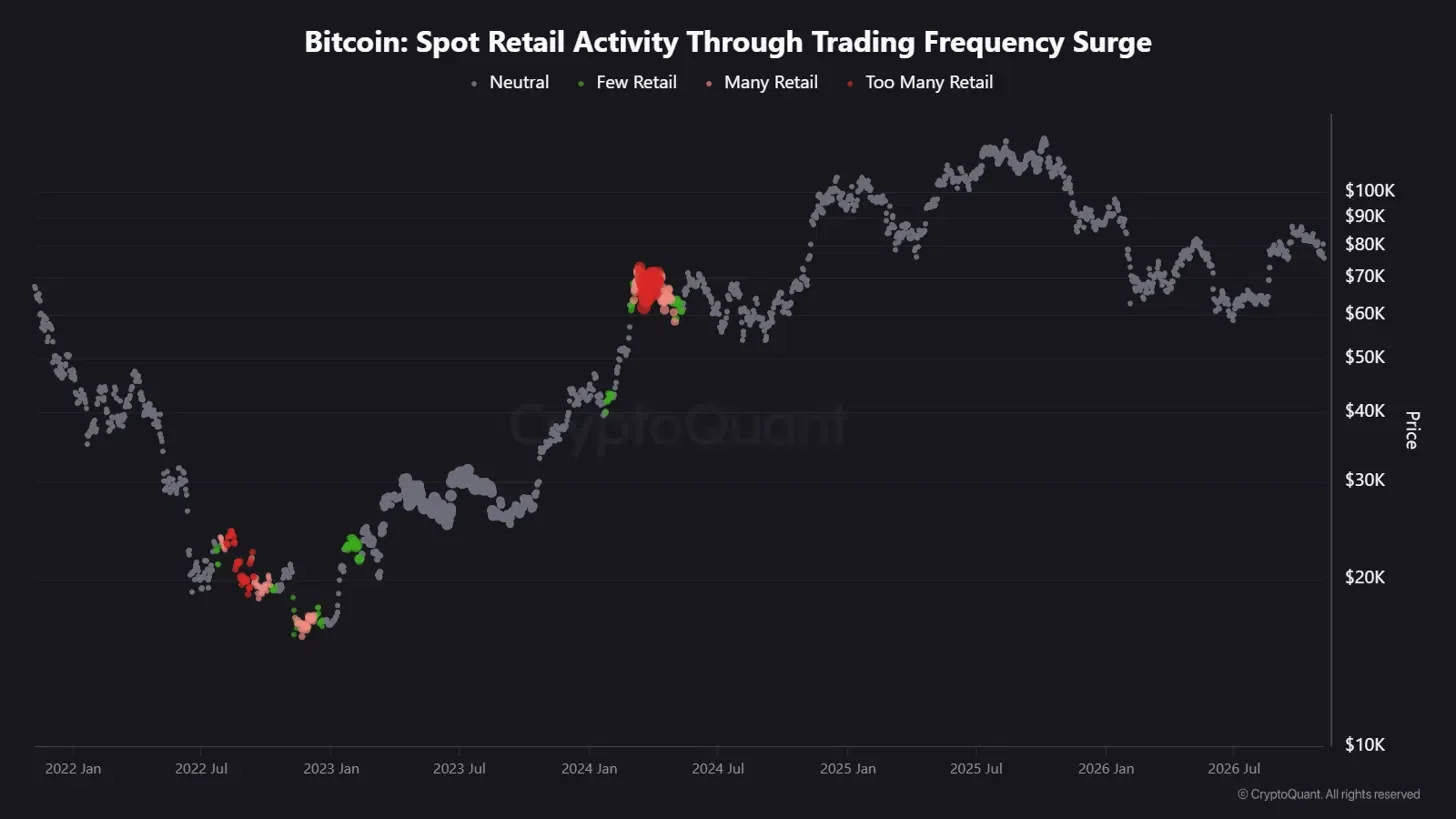
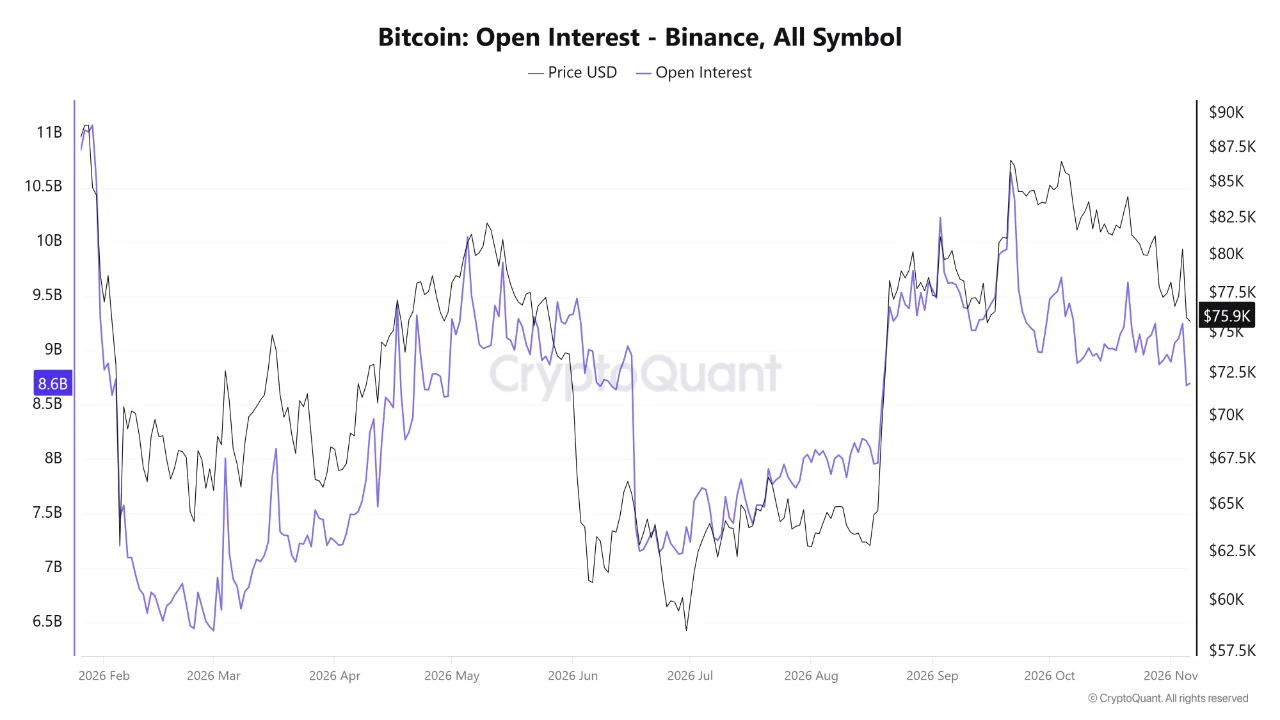
Two CryptoQuant analysis published on November 6 raise the question. BaykusCharts found that the platform’s retail-activity indicator never flashed a surge around Bitcoin’s October 2025 record near $126,000 or its roughly $60,000 lows this year. The analyst suggested that part of that activity moved into spot ETFs. Arab Chain reported Binance Bitcoin futures open interest at its lowest level in more than two months.
BaykusCharts argues that retail moved, not that it left. Testing that argument takes three things the posts do not provide: a clear sense of what the retail gauge counts, the Binance figure expressed in coins, and ETF flow data from the same days.
A relative gauge, not a headcount
CryptoQuant’s description of its Spot Retail Activity Through Trading Frequency Surge indicator explains the method. It compares trading frequency with its one-year moving average and flags periods when trade counts jump well above that baseline. A neutral reading means activity stayed inside its normal range. Trading can continue at a steady pace under a neutral reading, and the number of people trading never enters the calculation.
Trade counts reveal little about who is behind them. A fund can split one order into hundreds of fills, while an individual can buy once and hold for a year. The finding still carries weight: through a record high and a drawdown of roughly 50%, the frenzied trading bursts that marked earlier cycles never returned to crypto exchanges.
The Binance shock behind the futures low
Hackers drained about $6.3 billion from Binance on October 29, and the exchange suspended withdrawals. When it began reopening them, Binance said it had covered 95% of the stolen assets, the South China Morning Post reported. Reuters put net customer withdrawals after the reopening at $4.72 billion.
That timing changes what the futures figure can tell you. A trader who no longer trusts an exchange can close positions there and reopen them elsewhere. That move shrinks one venue’s open interest while leaving the trader’s Bitcoin exposure unchanged. Coins moved to private wallets also leave the exchange without being sold. A two-month low at Binance, recorded a week after Binance was robbed, is first of all a reading on Binance.
Converted to coins, Binance futures held steady
Dollar open interest equals the BTC-equivalent size of open contracts multiplied by a price, so a falling price shrinks the total even if no position closes. An earlier CryptoQuant QuickTake, written in late October before the hack, provides a pre-hack reading to compare against.
| Measure | Late October, pre-hack | November 6 |
|---|---|---|
| BTC price | $80,774 | Under $76,000 |
| Dollar open interest | $9.15 billion | $8.7 billion |
| Implied BTC exposure | About 113,300 BTC | About 114,500 BTC or more |
The dollar figure fell by roughly 5%, slightly less than the 6% drop in price. The price move alone would have cut about $540 million from the late-October positions, but the actual decline was smaller. That leaves the coin count marginally higher, not lower. Because the November price sat below $76,000, the implied exposure is a minimum.
The comparison rests on rounded figures from two posts and assumes both measured the same contracts at comparable prices. Coin-margined contracts, which have a fixed dollar size and settle in BTC, are valued differently, so a total that mixes contract types cannot be adjusted with a single spot price. Binance publishes the coin quantity and dollar value of open interest as separate fields, though only for about the latest month, so a cleaner check is possible while that window covers the hack.
Open interest also nets two sides of every trade. The late-October post found shorts slightly ahead of longs, and a steady total can hide longs closing while fresh shorts open, or forced liquidations replaced by new bets. It is a stock of contracts rather than a cash balance, so the roughly $450 million drop in dollar terms represents no withdrawal of money.

ETF flows point the other way this month
BaykusCharts’ migration case starts from a sound premise. Investors buying ETF shares trade through a brokerage, so their activity never reaches a crypto exchange’s trade counts, a difference in access covered in our guide to Bitcoin exchange-traded products versus coins in a wallet. Over a full cycle, that shift could keep an exchange-based retail gauge quiet even while individual demand grows.
Fund flows show whether the shift applies now. Unlike assets under management, flows count shares created or redeemed, so price swings do not distort them. US spot Bitcoin ETFs opened November with net outflows of about $399 million on November 2, led by roughly $405 million leaving BlackRock’s IBIT, according to Farside Investors data. A single session is not a trend, but in the week after the hack the funds were shedding money rather than absorbing it. That weakens migration as an explanation for this month’s quiet.
Flows still cannot say who sold. In creation and redemption data, a financial adviser rebalancing client portfolios looks the same as a self-directed buyer. A common shortcut treats ETF shares missing from institutional filings as retail-owned. However, the SEC’s Form 13F rules cover only managers with at least $100 million in reportable securities, and many reporting advisers manage money for individuals. Third-quarter filings are due November 16 and will show positions as of September 30, a month before the hack.
The case for a real retreat, and what could settle it
The strongest version of the retreat argument combines everything above: no retail surge for a full cycle, billions withdrawn from the largest exchange, and ETF holders redeeming in the same week. If individuals were stepping back from Bitcoin rather than switching venues, those signals would appear together.
What the argument lacks is a measurement linking those moves to the same people. Three data sets can narrow that gap through the rest of November.
Binance open interest in BTC
A falling coin count while price steadies would mark a genuine unwind. A flat count would point back to price effects.
ETF creations and redemptions
Redemptions spread across issuers would support a retreat. Creations returning would support the migration case.
CryptoQuant’s retail gauge
A surge flag on any rebound would contradict the absence story. Continued silence would leave it unproven.
The current data supports a narrower conclusion than either post implies. Binance derivatives traders kept roughly the same coin exposure through a record hack, and ETF holders, whoever they are, were net sellers in the days before that futures low.



Kosta has reported on cryptocurrency markets and blockchain infrastructure since 2020, bringing over six years of hands-on experience in the crypto industry built through daily tracking of markets, trends, and emerging blockchain developments. Specializing in Bitcoin on-chain analysis, institutional ETF flows, and digital asset price action, his work at Coindoo has been cited by other news agencies and consistently covers market developments with a focus on data-driven reporting across Bitcoin, Ethereum, Solana, and XRP. Over the years, Kosta has contributed to multiple crypto media outlets in different regions, authoring over 6,000 articles across the sector. His reporting spans cryptocurrency markets and the broader fintech industry, tracking not only price action but also the technological and regulatory forces shaping the ecosystem. To support his analysis, Kosta actively leverages on-chain data and metrics from leading platforms such as Santiment, Glassnode, and CryptoQuant, enabling deeper, evidence-based market insights. He believes in the power of transparency and the data that underpins the blockchain ecosystem. His academic background in Marketing Management from Denmark further complements his analytical approach, adding a strong understanding of communication strategy and content positioning to his work.