Bitcoin Tops Cost Basis But Still 62% of Recent Coins Underwater
Bitcoin traded near $77,900 after reclaiming the active-investor cost level it briefly lost on November 3, yet most coins bought in the past five months remain underwater.
Key Takeaways
- About 62% of recent-holder supply sits underwater
- Remaining long-liquidation band overlaps short-term-holder cost basis
- Short positions built above price during the decline
- ETF investors pulled $1.16 billion over three sessions
Glassnode’s “Idling at Support” report, published November 4, treats the pullback as a retest of levels Bitcoin reclaimed in August. Read alongside ETF flow data, it describes a market that has worked off much of its forced selling without attracting new buyers, while the share of recent coins held at a loss has grown.
Bitcoin Is Retesting the Levels It Reclaimed in August
The August and September advance lifted Bitcoin back above several references it had fallen below after its 2025 all-time high, including the 200-day average, the short-term-holder cost basis and Glassnode’s True Market Mean. The True Market Mean estimates the average acquisition price of actively circulating coins, leaving out long-dormant supply. The short-term-holder cost basis does the same for coins held for less than about five months.
Those reclaimed levels are now being tested from above. On November 3, Bitcoin closed just under the True Market Mean and slid toward $76,000 overnight as the U.S. midterm count came in, then recovered above it. Glassnode puts the pullback from the September high at about 10%.
Where the levels stack
Bitcoin at writing
True Market Mean · 0.3% below price
Short-term-holder cost basis · 2.8% below price
Remaining long-liquidation band · upper edge 2.4% below price
Level estimates from Glassnode’s November 4 report.
The more consequential detail sits below price. The short-term-holder cost basis falls inside the band where Glassnode still maps leveraged long positions. One is a cost reference that recent buyers watch; the other is a zone where leveraged longs would be forced to sell. With both in the same narrow range, a test of the cost basis would also test whether forced selling restarts.
Liquidations Ran Through Longs, Then Shorts Piled In
The slide from the September high triggered many of the long liquidation levels built during the rally, according to Glassnode’s liquidation heatmap, which estimates where leveraged positions would be forced to close. The exposure left on the long side is concentrated in that band below price, which also lines up with the 200-day average.
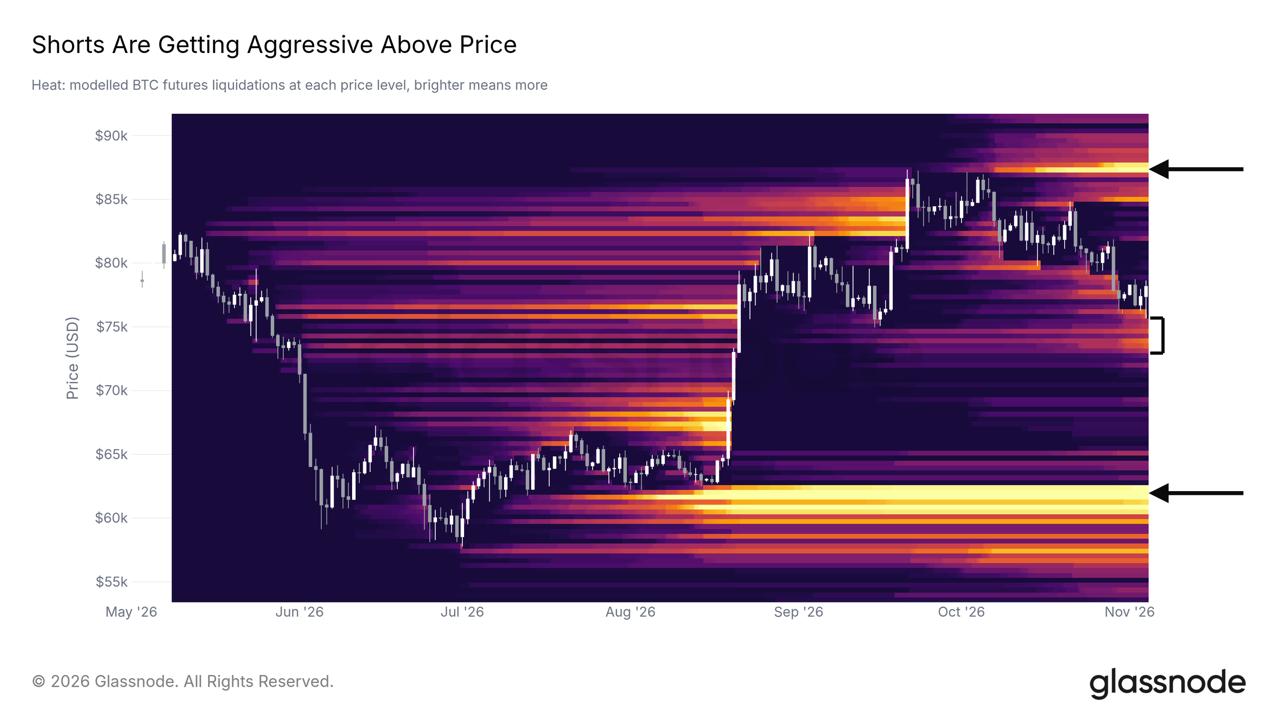
Positioning above price moved the other way. The heatmap shows liquidation levels stacked above Bitcoin growing over the past week while price dropped about 3.5%, a pattern Glassnode attributes to traders adding shorts on the way down. The largest overhead cluster sits near $87,000, close to the September high.
That changes what a bounce would prove. A climb toward those levels would force some short sellers to buy back their positions, and that buying comes from traders closing bets rather than investors adding exposure. A rally driven by short covering could look like demand on a price chart without showing up as demand in ownership data.
How Can Most Recent Supply Be Underwater Above Its Average Cost?
In early October, 97.5% or more of short-term-holder supply was in profit. Glassnode now puts that share at about 38%, which leaves roughly 62% of coins held for under five months below their acquisition price, even though Bitcoin trades above the cohort’s average cost.
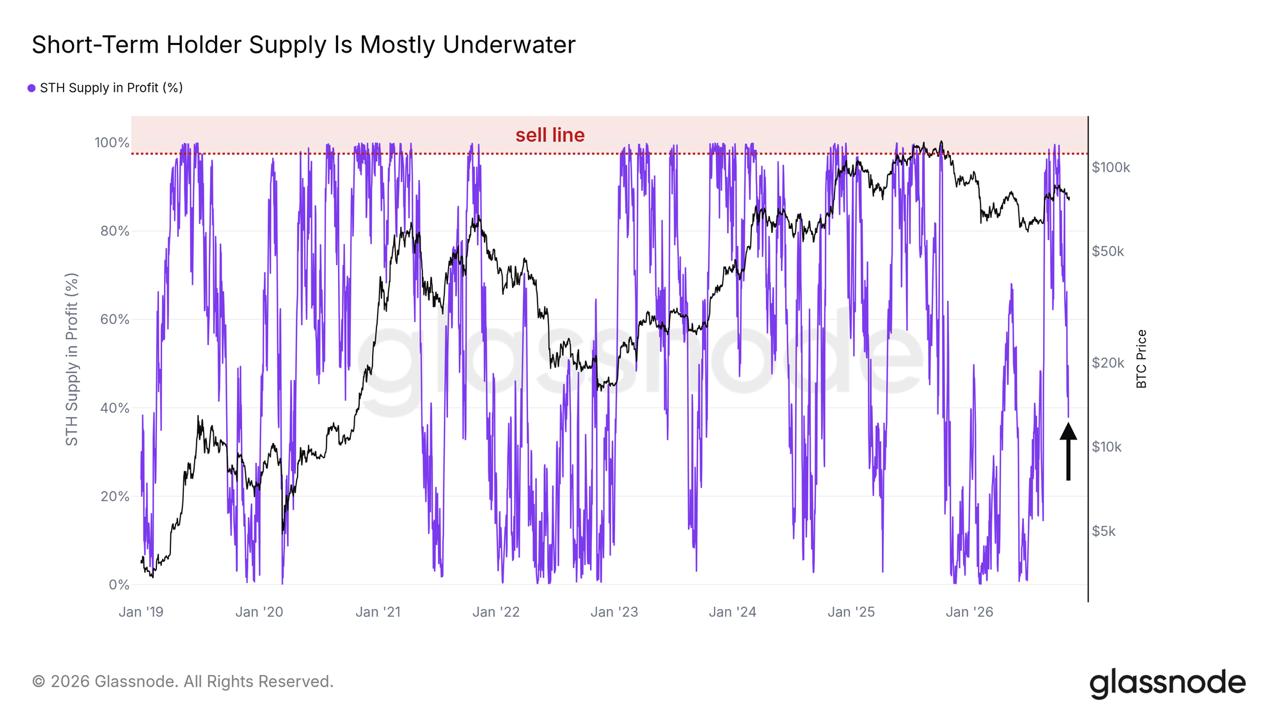
An average and a share in profit answer different questions. A small block of much cheaper coins can drag the average down while a larger block stays underwater. Take a simplified cohort in which 38% of coins were bought at $60,000 and 62% at $85,000: the average cost works out to about $75,500, below where Bitcoin trades now, yet 62% of the supply is held at a loss. Clearing the average says little about how many coins are back to break-even.
Glassnode builds these cohorts from entity-level on-chain estimates, with a gradual boundary around 155 days and exchange-held coins excluded. The 38% reading therefore measures coins in a modeled group rather than counting investors. A coin held at a loss has not been sold, but it has become a candidate for sale.
Those candidates form the second side of the market. Holders who bought above the current price get their money back only if Bitcoin rises toward their cost, and some may choose to exit once it does. Glassnode’s figures show how quickly that supply built up: the cohort went from almost entirely in profit to mostly underwater in about a month.
ETF Investors Are Still Redeeming
With forced selling reduced and potential sellers growing, the open question is who absorbs supply. U.S. spot Bitcoin ETFs, the most visible route for new traditional money, have not taken that role. Farside Investors’ data show net outflows of $643.2 million on October 30, $398.6 million on November 2 and $115.6 million on November 3, about $1.16 billion across three sessions.
Outflows narrowed by roughly 71% on November 3, and small inflows into Bitwise’s and Fidelity’s funds partly offset about $95 million leaving BlackRock’s IBIT. The day still closed negative, so the improvement was in the pace of selling, not a return of buyers.
Glassnode interprets the broader picture as money already inside crypto shifting between assets and venues, while traditional investors add little. Its previous weekly edition also estimated the average cost basis of U.S. spot ETF holders near $81,500. With Bitcoin below that level, the aggregate ETF position sits under its cost, which makes the ETF channel a second source of potential break-even supply rather than only a source of new demand.

The Case for a Healthy Reset
Glassnode’s own reading is more constructive. Retests after a breakout are routine, the firm argues, and this pullback has stripped out the excess built at the September high, leaving short-term holders far less stretched than a month ago. Spot volume has stayed above its pre-rally level, according to the report.
The market also absorbed the October 29 Binance breach, which the exchange estimated at about $6.3 billion and which ranks as the largest crypto theft on record. Glassnode treats the muted price reaction as a sign of strength, and it frames a hold of the band below price as a healthy reset inside the uptrend that began in August. The shorts added during the decline fit that view: traders positioned for further losses are the ones forced to buy if price recovers.
The two readings can both be true. A cleaner market structure and a missing buyer are separate conditions, and the reset case speaks to the first without resolving the second. Which one matters more for the recovery depends on whether flow data starts to agree with positioning data.
What Would Settle the Question
The signals below do not carry equal weight. Short-term-holder profitability rises mechanically with price, so its recovery would show recent holders recouping losses rather than new buyers arriving. ETF flows offer the more independent test, because they record money entering or leaving instead of revaluing coins already held.
Supports the reset reading
- Daily closes above the True Market Mean through the coming week, with no repeat of the November 3 slip
- Net ETF inflows in most of the next five trading sessions
- Short-term-holder supply in profit back above 50% in Glassnode’s next weekly edition
Undercuts it
- A daily close below the short-term-holder cost basis, putting price inside the long-liquidation band
- Redemptions returning to the scale of October 30
- Short-term-holder profit share falling further in Glassnode’s next weekly edition
Farside publishes ETF flows daily, while Glassnode refreshes its cohort data weekly, so the buyer side of the question gets tested first.



Kosta has reported on cryptocurrency markets and blockchain infrastructure since 2020, bringing over six years of hands-on experience in the crypto industry built through daily tracking of markets, trends, and emerging blockchain developments. Specializing in Bitcoin on-chain analysis, institutional ETF flows, and digital asset price action, his work at Coindoo has been cited by other news agencies and consistently covers market developments with a focus on data-driven reporting across Bitcoin, Ethereum, Solana, and XRP. Over the years, Kosta has contributed to multiple crypto media outlets in different regions, authoring over 6,000 articles across the sector. His reporting spans cryptocurrency markets and the broader fintech industry, tracking not only price action but also the technological and regulatory forces shaping the ecosystem. To support his analysis, Kosta actively leverages on-chain data and metrics from leading platforms such as Santiment, Glassnode, and CryptoQuant, enabling deeper, evidence-based market insights. He believes in the power of transparency and the data that underpins the blockchain ecosystem. His academic background in Marketing Management from Denmark further complements his analytical approach, adding a strong understanding of communication strategy and content positioning to his work.