Bitcoin Rebounds to $79K as On-Chain Metrics Signal $88K Target

Bitcoin is entering a regime transition near $79,000, where muted miner distribution and steady ETF inflows indicate a shift from market repair toward institutional price discovery.
Key Takeaways
- Bull-Bear cycle indicator signals market recovery.
- Miner selling pressure remains historically low.
- ETF demand supports a $87.8K target.
- Spot prices lag institutional capital accumulation.
Macro Cycle Transition: Releasing Systemic Stress
Bitcoin is trading near $79,300 at the time of writing on August 27, 2026, but price action alone rarely confirms a lasting trend. Broader regime indicators often signal structural inflections well before spot markets break into new ranges. Right now, two independent on-chain metrics point to a market exiting its repair phase and transitioning toward broader liquidity expansion:
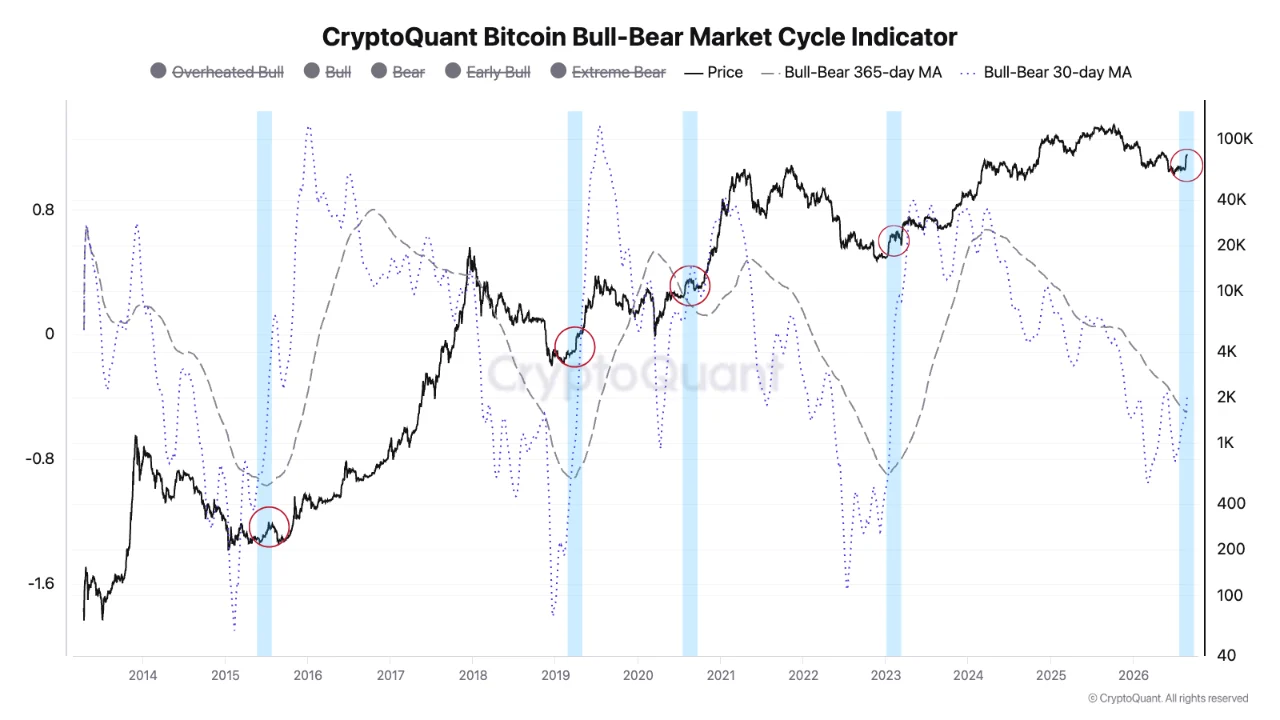
- Bull-Bear Market Cycle Crossover: According to a report shared by CryptoQuant, the 30-day moving average of the Bull-Bear Cycle Indicator has crossed sharply above its 365-day moving average. Identical crossovers occurred during the 2015, 2019, 2020, and 2023 recovery phases, consistently marking the boundary where deep market capitulation gives way to structural repair. Persistence remains essential here, as the crossover relies on spot demand remaining supportive over consecutive weekly closes.
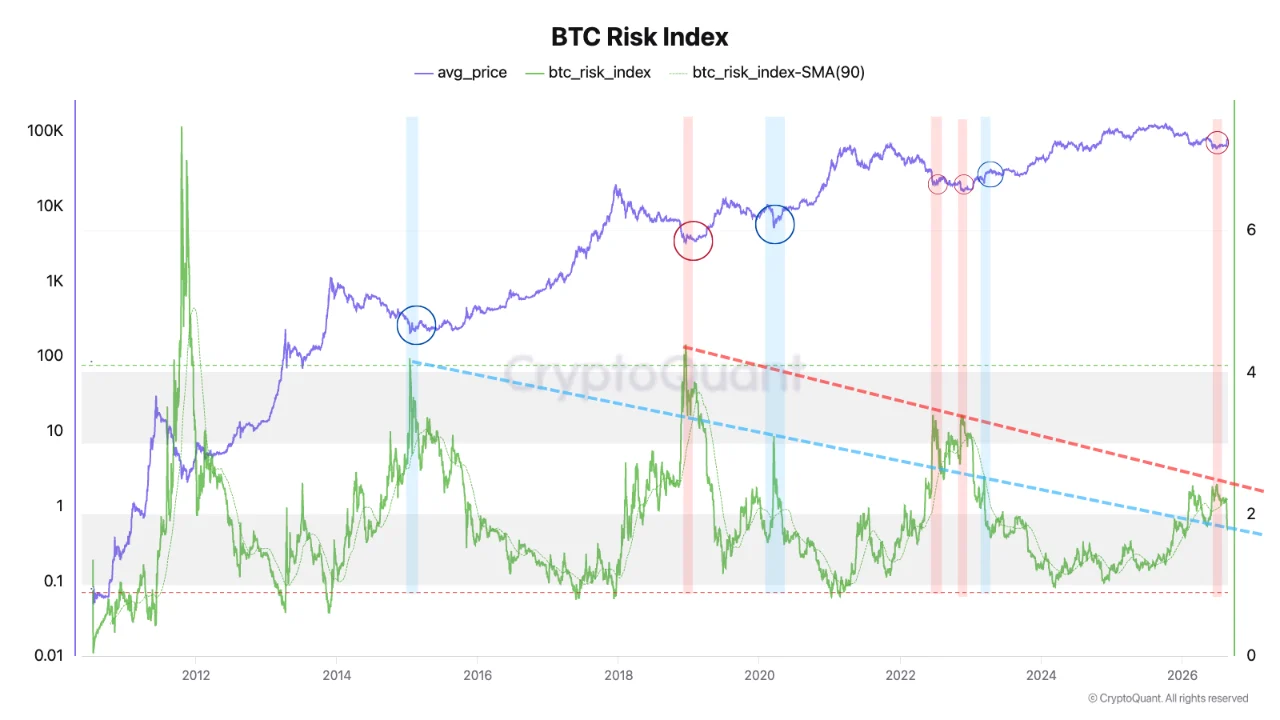
- BTC Risk Index Boundary Rejection: The Risk Index recently tested its primary descending trendline before turning lower. Rejections at this specific resistance band historically reflect a healthy release of market stress and a complete flush-out of over-leveraged weak hands. Falling index values from these historical boundaries signal that downside risk has been largely absorbed by the market.
Supply-Side Mechanics: Inactive Miner Selling
Sustained upward moves require limited sell-side overhead from structural network participants. Data tracking miner treasury behavior confirms that while routine liquidity management occurs, aggressive distribution remains entirely absent across major mining entities.
The Miners’ Position Index (MPI) stays consistently below 0, showing that overall miner wallet transfers remain lower than historical baseline averages. A recent single-day metric registered 4,857 BTC transferred to Binance (reflecting a 38.62% daily increase in exchange-bound transfers), but the negative MPI clarifies that these flows represent isolated treasury rebalancing or short-term hedging rather than a coordinated liquidation event.
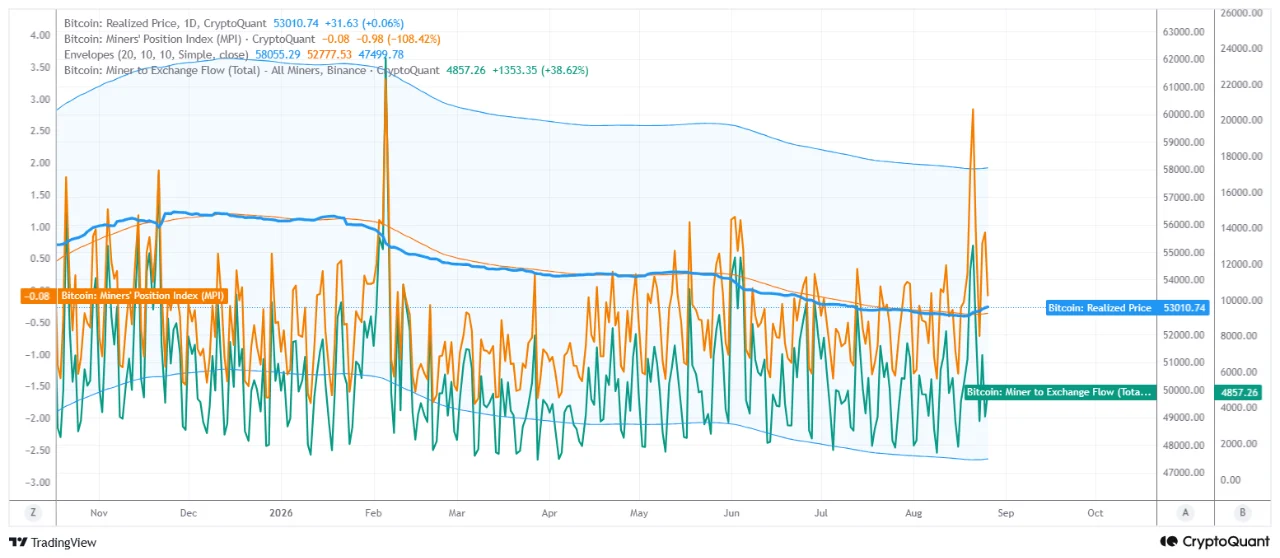
Because new network emissions are absorbed cleanly without aggressive miner dumping, structural supply pressure remains low, creating a clear runway for incoming buy liquidity.
On-Chain Metrics Matrix
The table below maps how institutional demand metrics, miner distribution patterns, and cycle indicators interact across current market conditions:
| Market Dimension | Primary Metric | Current Status | Structural Implication |
|---|---|---|---|
| Institutional Demand | EFIS Implied Model Price | Target: ~$87,800 30-Day Flow: +0.11% |
Spot price (~$79K) trails accumulated ETF inflows by roughly 10%. Reclaiming $87.8K validates full institutional repricing. |
| Supply Pressure | MPI & Exchange Inflows | MPI < 0 (Negative) Binance Flow: 4,857 BTC |
Miners are holding inventory; overall sell pressure remains neutral-to-supportive despite short-term exchange transfers. |
| Macro Cycle | Bull-Bear 30/365 DMA | Golden Cross Active Risk Index Lower |
Systemic stress has cleared as moving averages pivot out of capitulation toward a broader market repair phase. |
Institutional Demand: The $87.8K Repricing Target
Headline ETF net inflow numbers often misrepresent true market absorption because they fail to account for total Assets Under Management (AUM). The ETF Flow Impact Score (EFIS) resolves this distortion by converting daily share creation and redemption into BTC, normalizing those flows against total ETF AUM, and calculating their cumulative impact on market price.
Across the latest seven reporting sessions, spot Bitcoin ETFs absorbed approximately 34,800 BTC (equivalent to $2.52 billion in capital inflows). This push restored the 30-day AUM-normalized flow average to +0.11%, reversing the persistent outflow pressure recorded during mid-July.
The Structural Valuation Gap
The EFIS model currently places Bitcoin’s flow-implied price near $87,800, roughly 10% above spot prices (~$79,000). This gap marks the critical boundary where spot prices reconnect with the institutional demand accumulated through the ETF market. A decisive reclaim of $87.8K would confirm that spot prices have caught up with the institutional structure beneath the rally. Conversely, failing to reach or hold this level implies institutional demand is functioning as baseline market support rather than driving immediate price expansion.
However, before testing the $87.8K level, spot price must first clear heavy overhead resistance at the $80,000 threshold. On-chain data indicates this $80K level aligns closely with the aggregate cost basis of US spot ETF holders, creating a critical supply wall where buyers seek to de-risk or reach breakeven, as detailed in our analysis on the $80,000 ETF cost-basis levels.
Market Synthesis
Integrating cycle crossovers, miner positioning, and normalized ETF metrics establishes a clear three-phase framework for current market dynamics:
- Stress Clearance: Risk Index trendline rejections and Bull-Bear moving average crossovers confirm that post-capitulation market repair is well underway.
- Unconstrained Absorption: Muted miner distribution (MPI < 0) leaves incoming capital flows unencumbered by heavy structural selling.
- Valuation Catch-Up: The $87,800 level serves as the primary test for whether spot momentum converts into full institutional repricing.
Methodology Note: This analysis evaluates ETF share creation and redemption data normalized against AUM, Miner Position Index (MPI) thresholds, and long-term moving average crossovers. Digital assets carry risk; on-chain data serves as market context and is not financial advice. Always do your own research.



Alex is Editor-in-Chief of Coindoo and co-founder of Millennial Media Group, with nearly a decade of experience covering financial markets - crypto first, then everything else. It started in 2016 with Bitcoin. Like most people at the time, he didn't fully understand it - so he kept digging. Blockchain, tokenomics, the projects, the cycles. That curiosity never stopped, and eventually pulled him into traditional markets too: equities, commodities, macro. Not because he left crypto behind, but because you can't properly understand one without the other. What drives him is straightforward: he wants to know why something is happening, not just that it's happening. Most market coverage stops at the headline - price up, price down, here's a chart. Alex finds that kind of reporting actively unhelpful. If you walk away from an article without understanding the mechanism behind the move, what did you actually learn? He holds a degree in Tourism from New Bulgarian University - not the most obvious path into financial markets, but markets have a way of pulling in people who are simply too curious to stay out. He has authored over 200 in-depth analyses and more than 10,000 articles across crypto and traditional finance. He still thinks every day in markets teaches him something new. That's probably why he hasn't stopped.