Bitcoin Fell Before Every Past US Midterm – Will 2026 Repeat It?

Bitcoin has declined during the August–September window before all three U.S. midterms in its trading history, then fallen further in the fourth quarter each time.
Bitcoin fell into each of the last three U.S. midterms, yet rallied hard in late summer 2026, a break the halving clock explains better than the ballot box.
- Updated November 2, 2026
Key Takeaways
- Three prior midterms saw late-summer Bitcoin declines.
- 2026 broke that run with a rally.
- Halving drift may have pulled the low earlier.
- The vote matters most for the CLARITY Act.
CoinGlass quarterly data shows Bitcoin closed the third quarter of 2026 up 42.7%, its second-best third quarter on record.
Three Midterms, Three Late-Summer Slides
Before 2026, the record looked consistent. The three previous midterms were held on November 4, 2014, November 6, 2018 and November 8, 2022. Each time, Bitcoin sold off in the weeks before the vote, kept falling through the fourth quarter and bottomed only after ballots were counted.
Pre-vote drawdown and fourth-quarter return, by midterm year
Three outcomes in a row is weak evidence. If each year were a coin toss, three straight declines would turn up one time in eight. The measured windows are not even equal: seven weekly candles in 2014 against nine in 2018 and 2022.
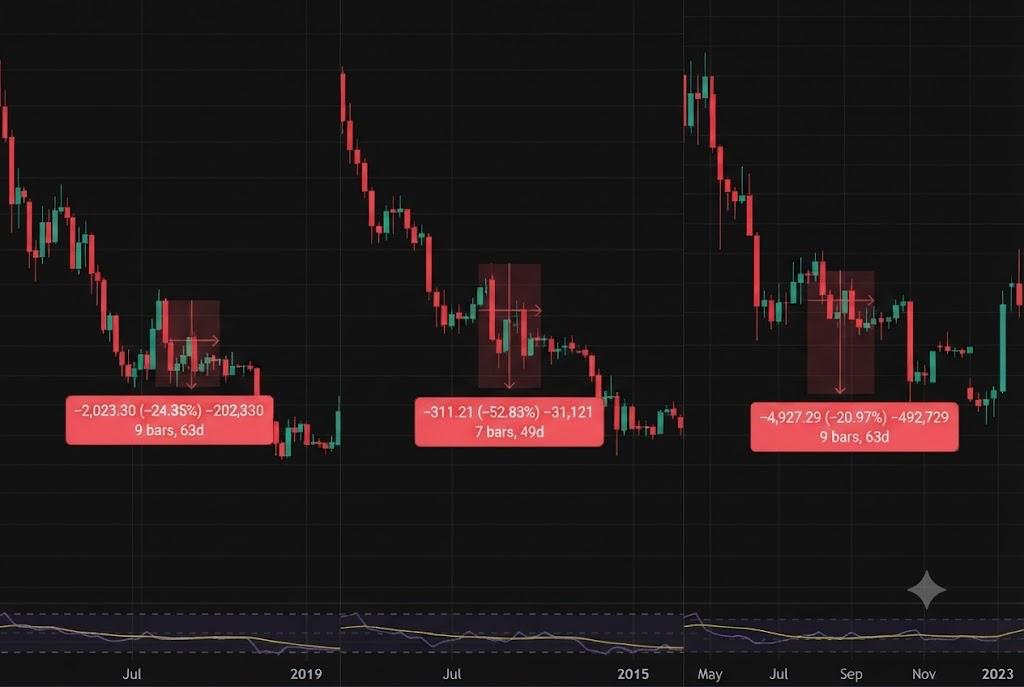
The red fourth quarters also cut against Bitcoin’s reputation. CoinGlass averages rank Q4 as its strongest quarter, but those averages lean on triple-digit rallies from years when the market was a fraction of its current size.
2026 Went the Other Way
This year, the window that sank Bitcoin three times produced a stretche. After losses of 22.2% in the first quarter and 14.1% in the second, price spent July boxed in the low-to-mid $60,000s, broke out on a surge in volume in mid-August and topped near $87,400 in late September.
Spot ETF demand also helped. U.S. spot Bitcoin funds took in $6.34 billion in net inflows during the third quarter, according to SoSoValue data, reversing roughly $5 billion of outflows in the second.
An election-driven pattern has no answer for that. Nothing about the 2026 campaign calendar differed from 2014, 2018 or 2022 in a way that would turn a late-summer slide into a rally. The halving calendar did differ.
The Halving Clock Moved, the Election Clock Did Not
Bitcoin’s issuance halves roughly every four years, but the schedule runs on block count, not dates. Blocks have tended to arrive slightly faster than the ten-minute target, so each halving has landed earlier in its calendar year: November 2012, July 2016, May 2020 and April 2024. Midterms stay fixed to November.
In past cycles, the bear-market low arrived 25 to 30 months after each halving: January 2015 near $155, December 2018 near $3,160 and November 2022 around $15,550. That interval happened to end on or shortly after election day each time, which is why the declines looked electoral.
Apply the same lag to April 2024 and the window runs from late May to October 2026, months ahead of the vote. Bitcoin’s late-June swing low close to $57,700 landed about 26 months after the halving, inside that range.
The path there had two legs. An early-February flush took price to near $60,000 and June undercut that level only slightly before the August breakout.
The longer chart also gives two reasons for caution. Bitcoin peaked around $126,000 in early October 2025, so the June low marks a decline of about 54%, far shallower than earlier bear markets, each of which erased more than three-quarters of the price. Earlier lows also arrived roughly a year after the cycle top; the same gap from October 2025 would land in October or November 2026, not June.
The halving reading rests on the same three cycles as the election one, so it deserves the same suspicion. Its advantage is a mechanism. Each halving cuts the new supply reaching miners and, eventually, the market, while an election has no direct channel into Bitcoin’s supply or demand. Whether June stands as this cycle’s floor is still open, and previous cycle bottoms were only obvious in hindsight.
What Made the Earlier Slides Deeper
The halving lag accounts for when those declines happened. It does not account for how far they ran, and each midterm year had its own accelerant.
In 2014, the market was still absorbing the February collapse of Mt. Gox, once the dominant Bitcoin exchange, with no venue ready to replace its liquidity.
In 2018, the slide began days after the SEC rejected the Winklevoss twins’ proposed Bitcoin ETF in late July. The post-election leg followed the Bitcoin Cash hash war in mid-November, which pushed BTC below $6,000 and opened the way to December’s low.
In 2022, the slide from the mid-August high deepened after Federal Reserve Chair Jerome Powell’s hawkish Jackson Hole speech on August 26. FTX collapsed after the window, in November, and drove the fourth-quarter losses. Founder Sam Bankman-Fried was later convicted of fraud and sentenced to 25 years in prison.
Two of those three accelerants came from inside crypto. The 2022 one came from the Fed, and the market Bitcoin trades in today looks far more like 2022’s than 2014’s.
This Cycle Answers to Flows, Rates and Oil
No earlier midterm had U.S. spot Bitcoin ETFs. The SEC approved them in January 2024, and they now carry most new institutional demand. They redeem as efficiently as they absorb, and the advisers and allocators using them weigh Bitcoin against equities, bonds and Treasury yields rather than against other tokens.
Those yields are rising, not falling. The Federal Reserve raised its target range by a quarter point in September and, on October 28, held it at 3.75% to 4%, describing inflation as elevated. Two officials, Lisa Cook and Beth Hammack, voted for another hike.
Energy is a large part of that inflation picture. The U.S. Energy Information Administration’s October outlook put Brent’s September average at $114 a barrel, up $23 from August, and raised its 2026 forecast to $96 from $91.
Bitcoin rallied through both the September oil spike and the September hike, so neither sets its direction alone. The pressure builds through flows instead. Every step toward tighter policy raises the yield an ETF buyer gives up to hold an asset that pays none. We covered why the first Iran shock failed to break Bitcoin; a Fed leaning toward hikes while oil sits near $100 tests a different channel.

Bitcoin on the Eve of the Vote
On the Bitstamp daily chart, Bitcoin traded at $78,034 on the morning of November 2, the day before the midterms, roughly 11% below its late-September high.
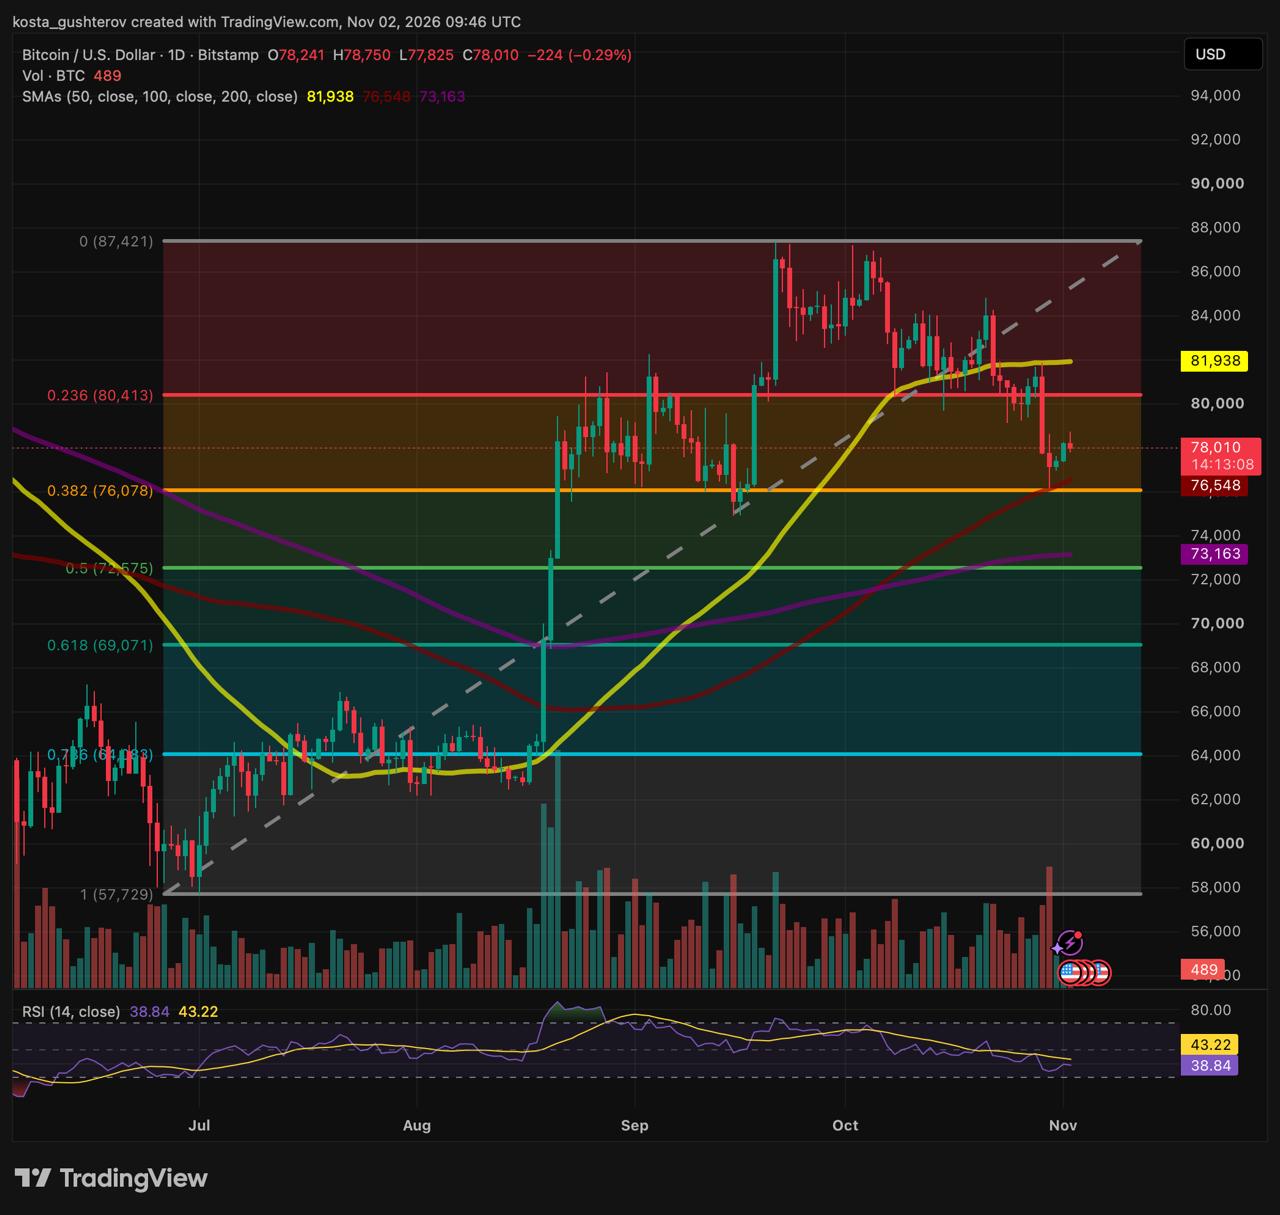
The August breakout mattered because of where it happened. The spring rebound had stalled at the 200-day moving average near $83,000 in May. The August move cleared that average, and by early September the 50-day had crossed back above the 200-day, reversing the bearish cross of late November 2025.
A mid-September dip lined up with the CLARITY Act’s failed Senate vote and the Fed’s hike a day later. Buyers absorbed it within days and pushed price to the high, but sellers capped two attempts there, in late September and early October. In the second half of October, price slipped under the rising trendline drawn from the June low. The sharpest drop came right after the Fed’s October 28 meeting, and it found buyers at the 100-day moving average, near the 38.2% Fibonacci retracement of the June–September rally.
Momentum has cooled without breaking. The daily RSI sits near 39, below its signal line and under 50 but well clear of oversold territory. The 50-, 100- and 200-day averages remain stacked in bullish order, and the 200-day has turned higher for the first time since late 2025, though the 50-day has flattened. On the chart, this is a pullback inside the summer uptrend, not yet a reversal of it.
Levels the daily chart puts in play
A daily close above the 23.6% retracement near $80,413 and the 50-day average at $81,939 would bring the $84,000 area, where October’s bounce stalled, back into view.
Closing below the 100-day average at $76,548 and the 38.2% level around $76,078 would expose the 200-day at $73,163 and the 50% retracement near $72,575, with the 61.8% level close to $69,071 beneath.
Neither path is a forecast. An election-night swing in risk appetite, the Fed’s December meeting or a turn in ETF flows could override both.
What the Vote Actually Changes for Crypto
Voters go to the polls on November 3. Decision Desk HQ’s late-October forecast gave Democrats about an 80% chance of winning the House and 57% for the Senate. With President Donald Trump in the White House until January 2029, a flip of either chamber produces divided government.
That matters less for Bitcoin, which already reaches U.S. portfolios through regulated funds, than for the tokens, exchanges and issuers still waiting for Congress to settle whether they fall under SEC or CFTC oversight.
The vehicle for that answer, the Digital Asset Market Clarity Act, passed the House 294-134 in July 2025 and cleared the Senate Banking Committee 15-9 in May. On September 15, it failed a Senate cloture vote 49-50, eleven short of the 60 needed to begin debate. Democrats objected that its ethics provisions did not go far enough on the president’s own crypto businesses.
The bill stays on the Senate calendar, so leadership can try again during the lame-duck session. That window closes on January 3, 2027, when the 119th Congress ends and unfinished bills expire. American Banker’s assessment after the vote was that the setback had likely stalled the bill until the next Congress.
If it expires, market-structure legislation restarts in 2027 under new negotiators, and Democrats’ conflict-of-interest demands would carry more weight. Bitcoin would feel that through broader sentiment; altcoins and U.S. crypto businesses would feel it in substance.
What Could Settle the Argument
The halving reading holds up if the late-June low survives the lame-duck period and the months after it, whichever party wins. It weakens if Bitcoin breaks below that low. The 25-to-30-month window closed in October, so any lower low would fall outside the range all three earlier cycles respected.
The election reading has its own test. If the vote itself drove the earlier slides, pressure should ease once results are known. If Bitcoin instead keeps tracking ETF flows, Fed decisions and oil through December, the midterm link was a coincidence of timing all along.
Three cycles taught traders to brace for a midterm sell-off. The fourth arrived with Bitcoin already well off its low, and the likeliest reason sits in the block schedule rather than the ballot.
Disclaimer: This article is for informational purposes only and does not constitute financial or investment advice. Historical cycle behavior does not predict future prices.
Methodology: Pre-election drawdowns for 2014, 2018 and 2022 come from TradingView weekly charts. The 2026 chart reading and cycle-high context come from the Bitstamp BTC/USD daily chart on TradingView. Quarterly returns are from CoinGlass and ETF flows from SoSoValue. Halving dates come from block-height records; cycle-low prices from TradingView. Monetary policy is from the Federal Reserve’s October 28, 2026 statement, oil data from the EIA’s October 2026 Short-Term Energy Outlook, election probabilities from Decision Desk HQ, and the legislative record from congress.gov and American Banker.



Kosta has reported on cryptocurrency markets and blockchain infrastructure since 2020, bringing over six years of hands-on experience in the crypto industry built through daily tracking of markets, trends, and emerging blockchain developments. Specializing in Bitcoin on-chain analysis, institutional ETF flows, and digital asset price action, his work at Coindoo has been cited by other news agencies and consistently covers market developments with a focus on data-driven reporting across Bitcoin, Ethereum, Solana, and XRP. Over the years, Kosta has contributed to multiple crypto media outlets in different regions, authoring over 6,000 articles across the sector. His reporting spans cryptocurrency markets and the broader fintech industry, tracking not only price action but also the technological and regulatory forces shaping the ecosystem. To support his analysis, Kosta actively leverages on-chain data and metrics from leading platforms such as Santiment, Glassnode, and CryptoQuant, enabling deeper, evidence-based market insights. He believes in the power of transparency and the data that underpins the blockchain ecosystem. His academic background in Marketing Management from Denmark further complements his analytical approach, adding a strong understanding of communication strategy and content positioning to his work.