Bitcoin Drops to $74,500: Key Levels to Watch This Weekend
Bitcoin is trading at $74,526 on the daily chart as of May 23, having broken below the SMA50 and approaching its next identifiable structural support in the current decline.
- BTC trading at $74,526, down 1.34% on the day, below SMA50 at $76,544
- Fibonacci 0.382 at $74,179: first structural support below current price
- SMA200 at $80,682 rejected price multiple times in May before breakdown
- SMA100 at $72,619: next major support if Fibonacci 0.382 fails
- RSI at 37.43, signal at 51.29: momentum firmly negative on daily
How the Breakdown Developed
Multiple rejections at the SMA200 near $80,682 throughout May established the ceiling that price could not clear. After several failed attempts to break above the SMA200, Bitcoin began losing the upward momentum that had been driving the market since late April. The break below the SMA50 at $76,544 was the structural confirmation of that momentum loss.
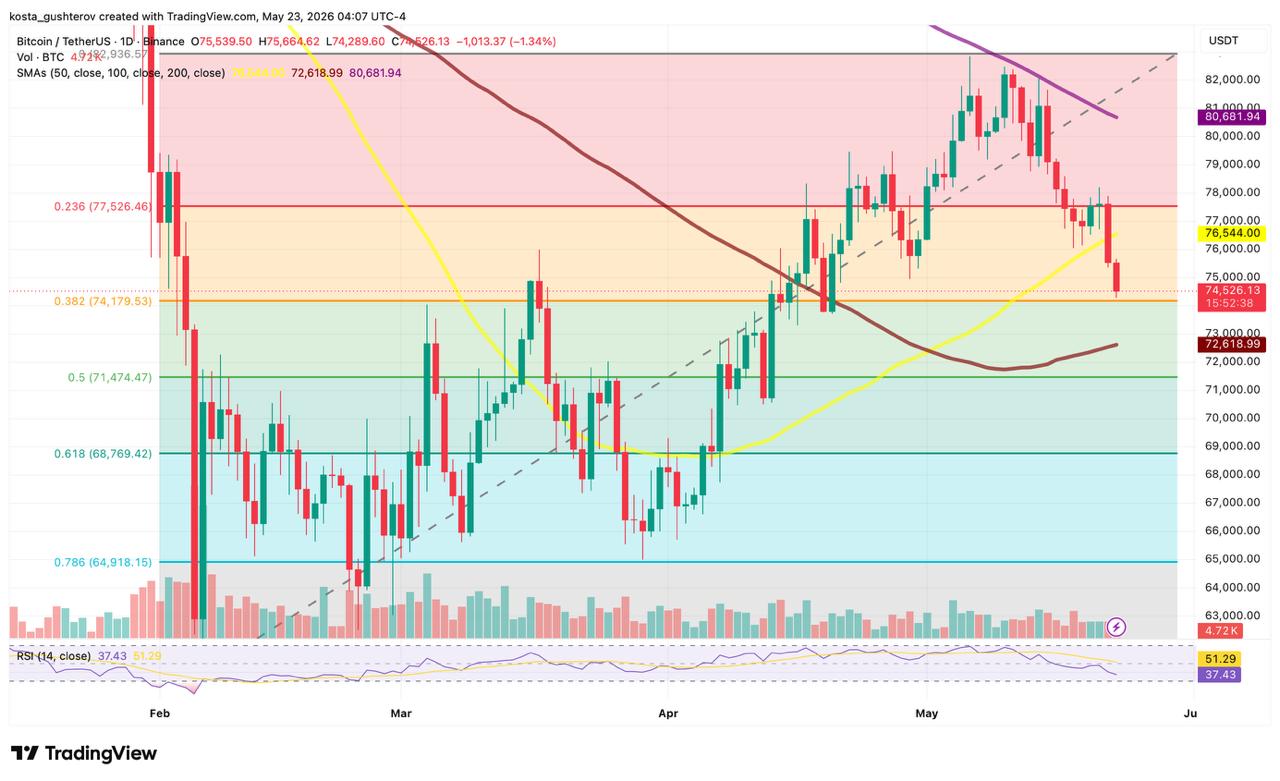
Bitcoin breaking below the SMA50 at $76,544 did not just remove a moving average support: it opened the direct path to the Fibonacci 0.382 level at $74,179 with no labeled support in between, which is why the decline from the SMA50 break to the current price covered $2,017 without a meaningful pause. The RSI had already been weakening through this period and is now at 37.43, sitting 13.86 points below its signal line at 51.29, confirming the momentum remains with sellers on the daily timeframe.
Where Price Is Now and Why $74,179 Matters
The Fibonacci 0.382 at $74,179 is the first level where the chart shows any structural basis for stabilization, and the current price at $74,526 sitting $346 above it means the level has not yet been tested on a closing basis. Fibonacci retracement levels are analytically significant because traders use them to measure potential correction zones within a larger trend. In this case the 0.382 level at $74,179 coincides with a zone where the chart shows previous local price reactions, adding to its structural relevance.
The current session’s low reached $74,289, which came within $110 of the Fibonacci level without closing below it. Whether the daily candle closes above $74,179 is the session’s defining question.
What Happens Below $74,179
If Bitcoin loses the Fibonacci 0.382 level on a daily closing basis, the chart’s next labeled support is the SMA100 at $72,619. Analytically, a local support zone near $73,750 has been identified in the source analysis as a potential intermediate level between the Fibonacci 0.382 and the SMA100, though this level is not labeled on the chart and should be treated as an analytical observation rather than a chart-readable figure.
Multiple rejections at the SMA200 near $80,682 throughout May, followed by the SMA50 break and the current approach of the Fibonacci 0.382, describe a technical deterioration that has moved through three distinct structural levels in sequence rather than all at once.

What a Recovery Requires
For the current decline to stabilize, Bitcoin first needs to hold the Fibonacci 0.382 zone and stop the sequence of lower daily closes. Reclaiming $75,000 would be the next step, as that level now functions as resistance after the breakdown through it. Analytically, a recovery above $75,500 would be the first meaningful signal that short-term selling pressure is weakening, though that level is not labeled on the chart and represents an analytical threshold rather than a chart-verified support or resistance.
Until price reclaims $75,500 or higher, the RSI remaining below its signal line and all three MAs declining above current price keep the technical picture oriented downward.
The information provided in this article is for educational purposes only and does not constitute financial, investment, or trading advice. Coindoo.com does not endorse or recommend any specific investment strategy or cryptocurrency. Always conduct your own research and consult with a licensed financial advisor before making any investment decisions.

Kosta has reported on cryptocurrency markets and blockchain infrastructure since 2020, bringing over six years of hands-on experience in the crypto industry built through daily tracking of markets, trends, and emerging blockchain developments. Specializing in Bitcoin on-chain analysis, institutional ETF flows, and digital asset price action, his work at Coindoo has been cited by other news agencies and consistently covers market developments with a focus on data-driven reporting across Bitcoin, Ethereum, Solana, and XRP. Over the years, Kosta has contributed to multiple crypto media outlets in different regions, authoring over 6,000 articles across the sector. His reporting spans cryptocurrency markets and the broader fintech industry, tracking not only price action but also the technological and regulatory forces shaping the ecosystem. To support his analysis, Kosta actively leverages on-chain data and metrics from leading platforms such as Santiment, Glassnode, and CryptoQuant, enabling deeper, evidence-based market insights. He believes in the power of transparency and the data that underpins the blockchain ecosystem. His academic background in Marketing Management from Denmark further complements his analytical approach, adding a strong understanding of communication strategy and content positioning to his work.