HYPE Reaches $55 Between Whale Sales and Fee-Funded Buys

Hyperliquid's pullback is reaching the part of the chart that has kept its broader uptrend alive.
Key Takeaways
- HYPE is testing rising-channel support near $55 after retreating from its July channel resistance.
- A reclaim of $57 would mark the first improvement, but heavier resistance sits between $59 and $61.
- A tracked whale has sold more than $110 million in HYPE across two reported transactions.
- Hyperliquid’s Assistance Fund continues to turn part of the protocol’s fee revenue into HYPE purchases.
After meeting resistance at the upper boundary of its daily ascending channel in July, HYPE reversed and entered a correction that has now brought the token back toward $55.
This area combines the channel’s rising lower trendline with horizontal support around $54-$55, where buyers have repeatedly stepped in. As long as that confluence zone holds, the current decline can remain a pullback within the broader uptrend. A daily break below it would weaken the structure and expose the lower support levels.
HYPE Is Testing the Trendline Bulls Need to Defend
The sell-off has carried HYPE below the 0.236 Fibonacci retracement at $57 and both major daily moving averages shown on the chart. The latest rebound approached $57 but failed to reclaim it.
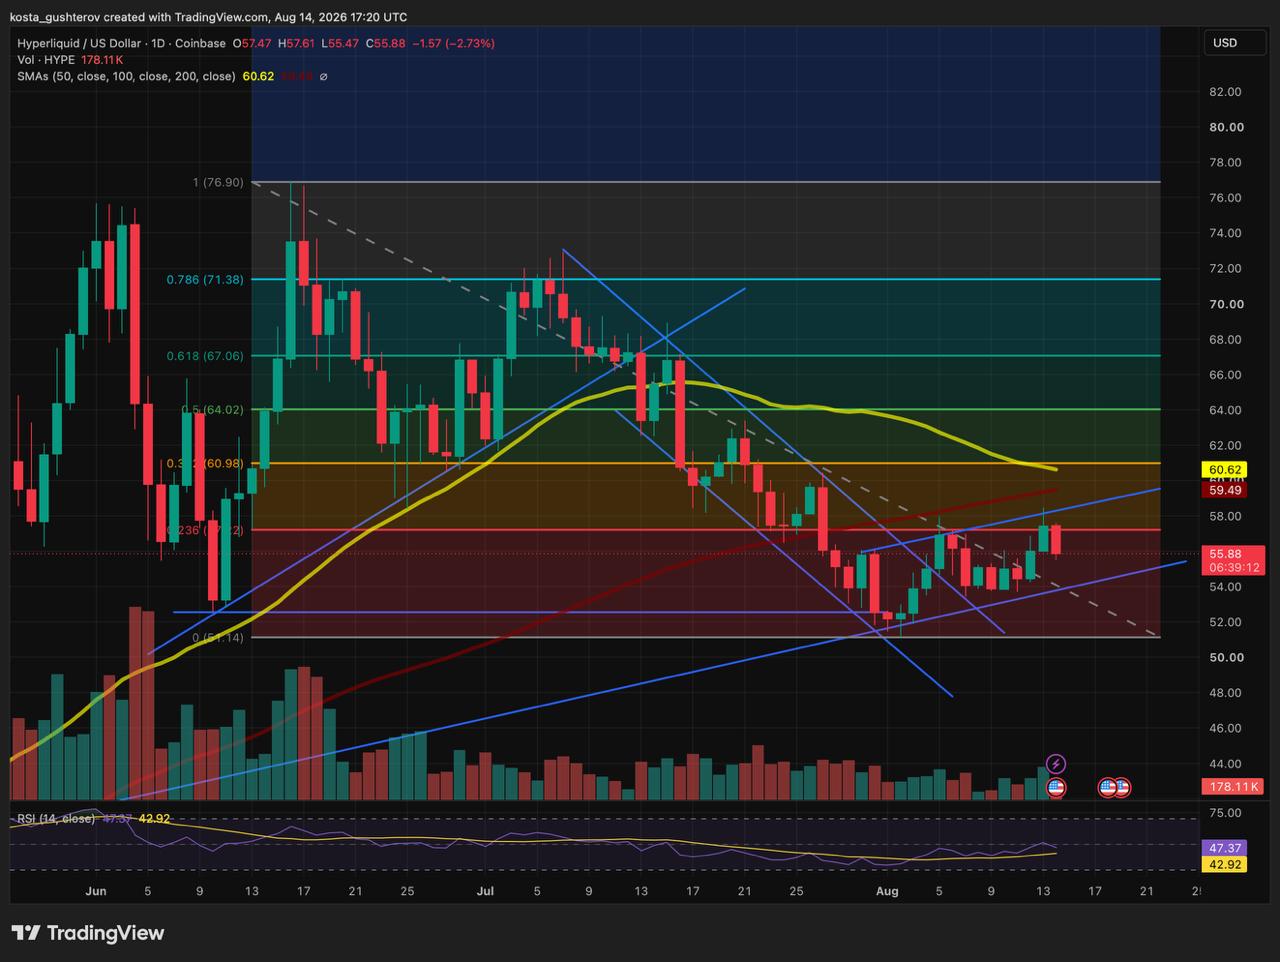
Resistance thickens immediately above that first hurdle. The 100-day SMA is near $59, while the 50-day SMA at $60.5 sits just below the 0.382 Fibonacci retracement around $61. This puts three technical barriers inside a narrow $59-$61 band.
Recovering $57 would be an initial step, not a full reversal of the correction. HYPE would still need to clear the moving averages and $60.98 before the 0.5 Fibonacci level near $64 comes back into view.
Momentum offers little support for that move so far. Daily RSI is near 47, a neutral reading that shows neither oversold conditions nor clear control by buyers.
Below the current price, a daily break of the channel trendline would expose the recent horizontal base at $52-$53. The Fibonacci range low near $51 would be the next major level if that base fails.
HYPE Whale Has Now Sold More Than $110M
The support test comes as a large holder continues to reduce a sizeable HYPE position.
Lookonchain reported on August 14 that a whale which once held 2.93 million HYPE had sold another 923,743 tokens worth approximately $53.02 million.
This whale, who held 2.93M $HYPE($163.37M), is selling $HYPE again!
2 weeks ago, he sold 1.03M $HYPE ($57.44M).
1 hour ago, he sold another 923,743 $HYPE($53.02M).
He still holds 969,595 $HYPE ($55.5M).https://t.co/8rUlKLP5sw pic.twitter.com/3dKmIq92zI
— Lookonchain (@lookonchain) August 14, 2026
Two weeks earlier, the same wallet sold 1.03 million HYPE valued at roughly $57.44 million. The two reported sales total more than $110 million.
Of the latest batch, roughly 692,807 HYPE went to Coinbase Prime and another 230,936 HYPE to FalconX. Lookonchain estimates that the wallet still holds 969,595 HYPE worth about $55.5 million.
Selling of that size can add pressure at a vulnerable point on the chart, but it does not explain the full correction. HYPE had already reversed from channel resistance before the latest transaction was reported.

Hyperliquid Fees Continue Funding HYPE Purchases
Whale supply is landing against a recurring source of protocol-driven demand. Hyperliquid routes part of its trading fees to the Assistance Fund, which automatically converts the revenue into HYPE. Higher activity on the platform can therefore generate additional token purchases.
Our analysis of how crypto platforms distribute their fees highlighted Hyperliquid for this direct connection between protocol usage and token demand.
The mechanism cannot be expected to absorb a large holder’s sales or prevent the trendline from breaking. It does, however, keep a protocol-funded buyer in the market while HYPE sits at the lower edge of its daily channel.
- Disclaimer: Fibonacci levels, moving averages and trendlines are based on HYPE’s daily chart and can shift as new price data develops. Lookonchain’s wallet analysis reflects observed on-chain activity and should not be taken as proof that the reported whale transactions caused HYPE’s decline. Nothing in this article constitutes financial or investment advice.



Kosta has reported on cryptocurrency markets and blockchain infrastructure since 2020, bringing over six years of hands-on experience in the crypto industry built through daily tracking of markets, trends, and emerging blockchain developments. Specializing in Bitcoin on-chain analysis, institutional ETF flows, and digital asset price action, his work at Coindoo has been cited by other news agencies and consistently covers market developments with a focus on data-driven reporting across Bitcoin, Ethereum, Solana, and XRP. Over the years, Kosta has contributed to multiple crypto media outlets in different regions, authoring over 6,000 articles across the sector. His reporting spans cryptocurrency markets and the broader fintech industry, tracking not only price action but also the technological and regulatory forces shaping the ecosystem. To support his analysis, Kosta actively leverages on-chain data and metrics from leading platforms such as Santiment, Glassnode, and CryptoQuant, enabling deeper, evidence-based market insights. He believes in the power of transparency and the data that underpins the blockchain ecosystem. His academic background in Marketing Management from Denmark further complements his analytical approach, adding a strong understanding of communication strategy and content positioning to his work.