Zcash Price Dips – Only 1% of Its $2.25B Leverage Cleared
Zcash (ZEC) is down about 2% on Saturday, trading near $1,157 after a rebound stalled at its 50-day moving average and leveraged traders absorbed roughly $23 million in liquidations.
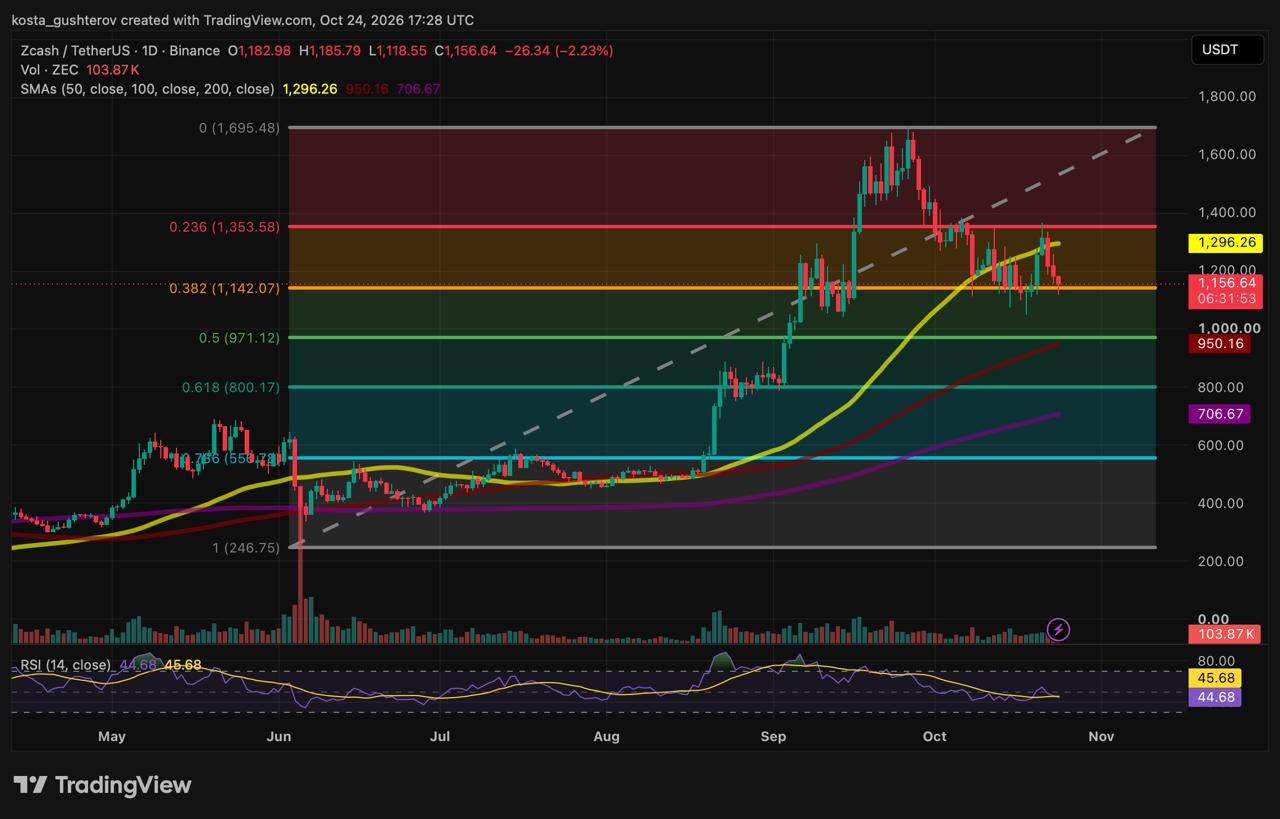
Binance’s ZEC/USDT daily chart on TradingView shows the token still trading more than 360% above its early-June low near $247, even after the latest pullback.
What happened at the 50-day SMA
Earlier this week, ZEC snapped back from the 0.382 Fib with the 50-day SMA as the obvious target. The average did its job as resistance: the rally’s candle left a long upper wick right at the line, a sign that sellers were waiting there. The slide since has pulled price back toward the same floor it bounced from.
Leverage took the hit, but most of it is still there
The damage showed up first in the futures market. About $22.8 million in ZEC futures positions were liquidated over the past 24 hours, mostly longs, according to CoinGlass. Over the same window ZEC fell roughly 7%, as Bitcoin briefly slipped below $80,000.
| $22.8MFutures liquidated (24h) | $2.25BOpen interest |
| ~1%Share of open interest flushed | ~15xFutures volume vs. spot (24h) |
The liquidation total sounds large until it is set against the size of the market. With open interest near $2.25 billion, the latest flush cleared only about 1% of outstanding futures positions, so leverage has barely been reset.
The rest of the data shows how much ZEC trading now runs through derivatives. Futures volume came to about $5.3 billion over the past day, roughly 15 times the $340 million traded on spot markets, and open interest equals around 12% of ZEC’s $19.5 billion market cap.
That cuts both ways. If the 0.382 floor breaks, a large pool of leveraged longs sits in the path of the decline and could add forced selling to it. If the floor holds and price turns up, the same heavy positioning could speed the move higher as shorts are forced to cover.
ZEC vs. XRP: same retreat, different damage
Today’s XRP chart makes a useful comparison. Both coins are pulling back from late-summer highs, but the damage looks very different.
| Measure | ZEC | XRP |
|---|---|---|
| Deepest Fib level tested | 0.382 | 0.618 (golden pocket) |
| Price vs. 100-day SMA | About 22% above | Below |
| Price vs. 200-day SMA | About 64% above | Below |
| 50-day SMA slope | Rising | Curling lower |
| Daily RSI | About 45 | About 36 |
The order of the averages is the same on both charts, with the 50-day above the 100-day and the 100-day above the 200-day. What differs is how much of that structure price has given up. ZEC’s pullback has also stopped at a much shallower point, with the 0.5 and 0.618 levels below it still untested, which suggests buyers are stepping in earlier.
Where the levels sit
| Level | Price | From current price |
|---|---|---|
| September peak | ~$1,695 | +46% |
| 0.236 Fib · start of the October breakdown | ~$1,354 | +17% |
| 50-day SMA · rejected the rebound | ~$1,296 | +12% |
| Current price | ~$1,157 | – |
| 0.382 Fib · being retested | ~$1,142 | −1% |
| 0.5 Fib + 100-day SMA | ~$950–$971 | −16% to −18% |
| Golden pocket (0.618–0.65 Fib) | ~$754–$800 | −31% to −35% |
| 200-day SMA · long-term baseline | ~$707 | −39% |
Chart note: daily ZEC/USDT candles from Binance on TradingView, with the latest candle still open. Fibonacci levels run from the early-June low to the September peak. Derivatives figures are a CoinGlass snapshot from Saturday afternoon (UTC) and update in real time.
Momentum and the bear case
RSI sits near 45, a touch below its signal line and the 50 midpoint. That reading points to an orderly pause rather than heavy selling, and a move back above 50 would put momentum back on the buyers’ side.
The bear case: this is the second test of the 0.382 in less than a week, and the first bounce stalled well short of the 0.236. A floor that keeps getting revisited gives bulls less room for error.
| ZEC is pinned between the 0.382 Fib near $1,140 and the 50-day SMA near $1,300. | ||
| Scenario | Trigger | What opens up |
|---|---|---|
| Upside | The floor holds and ZEC posts a daily close above the 50-day SMA | A possible move toward the 0.236 Fib, with the September peak a longer-term target if momentum returns |
| Breakdown | A daily close below the 0.382 before the end of October | The $950–$970 cluster could come into play |
| Bigger picture: Even a drop to that cluster would leave ZEC well above its 200-day SMA, with its uptrend structure in place. Only a slide into the golden pocket would put it in question. | ||
This article is provided for informational purposes only and does not constitute financial advice. Cryptocurrency prices are volatile.



Alexander Zdravkov is a market analyst and crypto journalist with interests in economics, broader financial markets and digital assets. His journey into crypto began more than four years ago, driven by a fascination with the rapid evolution of blockchain technology and the transformative potential of decentralized finance. He began analyzing market cycles and identifying emerging trends before they reach the mainstream. He holds a degree in International Relations - a background that helped shape his broader perspective on global economics, geopolitics, and the interconnected nature of modern financial markets. Whether covering the latest developments in the crypto sector or exploring broader macroeconomic themes, Alexander focuses on giving readers context rather than simply repeating headlines. During his career, he has authored more than 5,000 articles covering cryptocurrencies, traditional finance, and global market developments. His work spans everything from Bitcoin and altcoins to macroeconomic trends influencing risk assets worldwide.