XRP Price Jumps 7% After $1.32 Test – Can It Clear $1.47?
XRP gained about 7% after testing $1.32, but the daily chart shows that buyers still need to clear $1.47 before the rebound can become a convincing reversal.
Key Takeaways
- XRP rebounded after testing the $1.32 area.
- $1.41 is the first reclaimed support.
- $1.47 remains the decisive resistance level.
- $1.51 and $1.56 follow a breakout.
- Crowded leverage could weaken a breakout.
The $1.32 hold sets up XRP’s next test
XRP regained traction after sliding toward $1.32, the weakness covered in our earlier XRP price report. The latest advance has not reversed the full decline from $1.70, but it has created a clear support area for buyers to defend.
The move also arrived during a broader large-cap recovery, as our team explained in today’s crypto market analysis. That broader bid gives XRP support, but the token’s own chart now has a separate test.
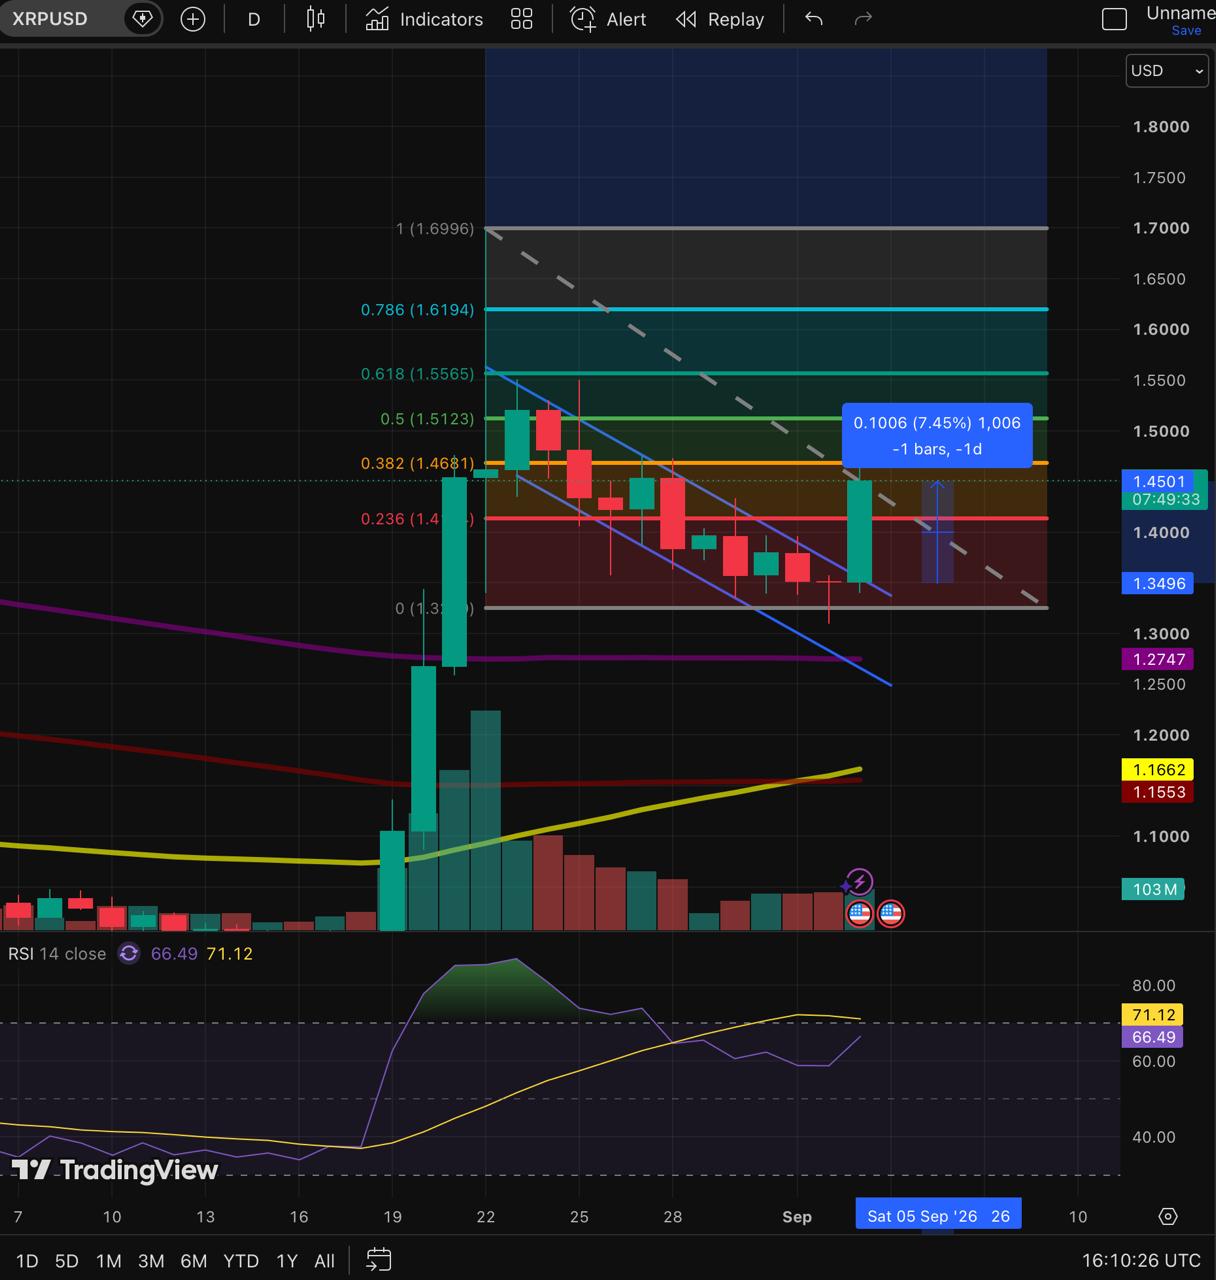
On the daily XRP/USD chart, price was trading above the upper boundary of its recent descending channel. This suggests that selling pressure may be easing, although the move still needs follow-through.
$1.47 matters more than the 7% gain
The Fibonacci range on the chart runs from the roughly $1.32 swing low to the prior high near $1.70. XRP has moved back above the 23.6% retracement near $1.41, but it was still trading below the 38.2% level at $1.47.
A daily close above $1.47 and successful retest would show that buyers have moved beyond the first bounce from support and begun to reclaim the earlier decline. Until then, the move remains a recovery attempt rather than a confirmed trend reversal.
Momentum has improved, but it is not stretched
Daily RSI was near 66.5 on the chart, up from the weaker readings seen during the pullback but still below the conventional 70 overbought threshold. That shows improving momentum without, by itself, confirming that the decline is over.
Leverage might show how durable the move is
The chart sets the levels, while derivatives data helps show the type of demand behind the advance. When checked, the live XRP futures dashboard on CoinGlass showed open interest at about $3.31 billion, while 24-hour futures volume reached $5.14 billion and spot volume was $1.13 billion.
Futures turnover was therefore about 4.5 times larger than spot turnover. That does not mean the move is purely leverage-driven; derivatives markets naturally carry more trading activity. It does mean XRP needs continued spot buying if the advance is to hold once short-term traders stop adding exposure.
Rising open interest is not automatically bullish or bearish. It can reflect new conviction, but it can also show that a move is becoming dependent on leveraged positions that may unwind quickly if price reverses.
Healthier confirmation
Spot volume keeps rising, XRP holds above support and open interest grows without an extreme increase in funding.
Less reliable advance
Futures activity and funding rise much faster than spot demand while XRP stalls beneath resistance.
What would weaken the setup
A loss of $1.41 would put the first recovery attempt under pressure and bring the $1.35 area back into focus. A move below the roughly $1.32 swing low would show that sellers still control the daily structure.
For now, XRP has interrupted its decline. A sustained move higher still depends on buyers proving that the latest demand can hold after the initial jump.
The article is provided for informational purposes only and does not constitute investment advice.



Alex is Editor-in-Chief of Coindoo and co-founder of Millennial Media Group, with nearly a decade of experience covering financial markets - crypto first, then everything else. It started in 2016 with Bitcoin. Like most people at the time, he didn't fully understand it - so he kept digging. Blockchain, tokenomics, the projects, the cycles. That curiosity never stopped, and eventually pulled him into traditional markets too: equities, commodities, macro. Not because he left crypto behind, but because you can't properly understand one without the other. What drives him is straightforward: he wants to know why something is happening, not just that it's happening. Most market coverage stops at the headline - price up, price down, here's a chart. Alex finds that kind of reporting actively unhelpful. If you walk away from an article without understanding the mechanism behind the move, what did you actually learn? He holds a degree in Tourism from New Bulgarian University - not the most obvious path into financial markets, but markets have a way of pulling in people who are simply too curious to stay out. He has authored over 200 in-depth analyses and more than 10,000 articles across crypto and traditional finance. He still thinks every day in markets teaches him something new. That's probably why he hasn't stopped.