XRP Nears $1 as Leverage Washout Echoes 2024 Setup
XRP is trading near $1.08 on July 17, compressed between the repeatedly defended support area at $1.03–$1.05 and a declining 50-day simple moving average at $1.13.
Key Takeaways
- XRP trades at $1.08 below all three major moving averages, which remain in bearish alignment.
- The $1.03–$1.05 shelf is the main support separating the current range from another test of the cycle low.
- Binance’s estimated leverage ratio is approaching its lowest level since November 2024.
- Falling open interest confirms that traders are reducing derivatives exposure rather than building new positions.
The chart remains bearish. Price sits below its 50-day, 100-day, and 200-day moving averages, every recovery since April has produced a lower high, and the latest bounce ended beneath the nearest moving-average resistance.
Derivatives positioning has become less aggressive during the decline. Both Binance’s estimated leverage ratio and all-exchange open interest have fallen sharply, showing that futures exposure is being removed. That reduces leverage-related fragility but does not provide the demand needed to reverse the price trend.
XRP Remains Below a Fully Bearish Moving-Average Stack
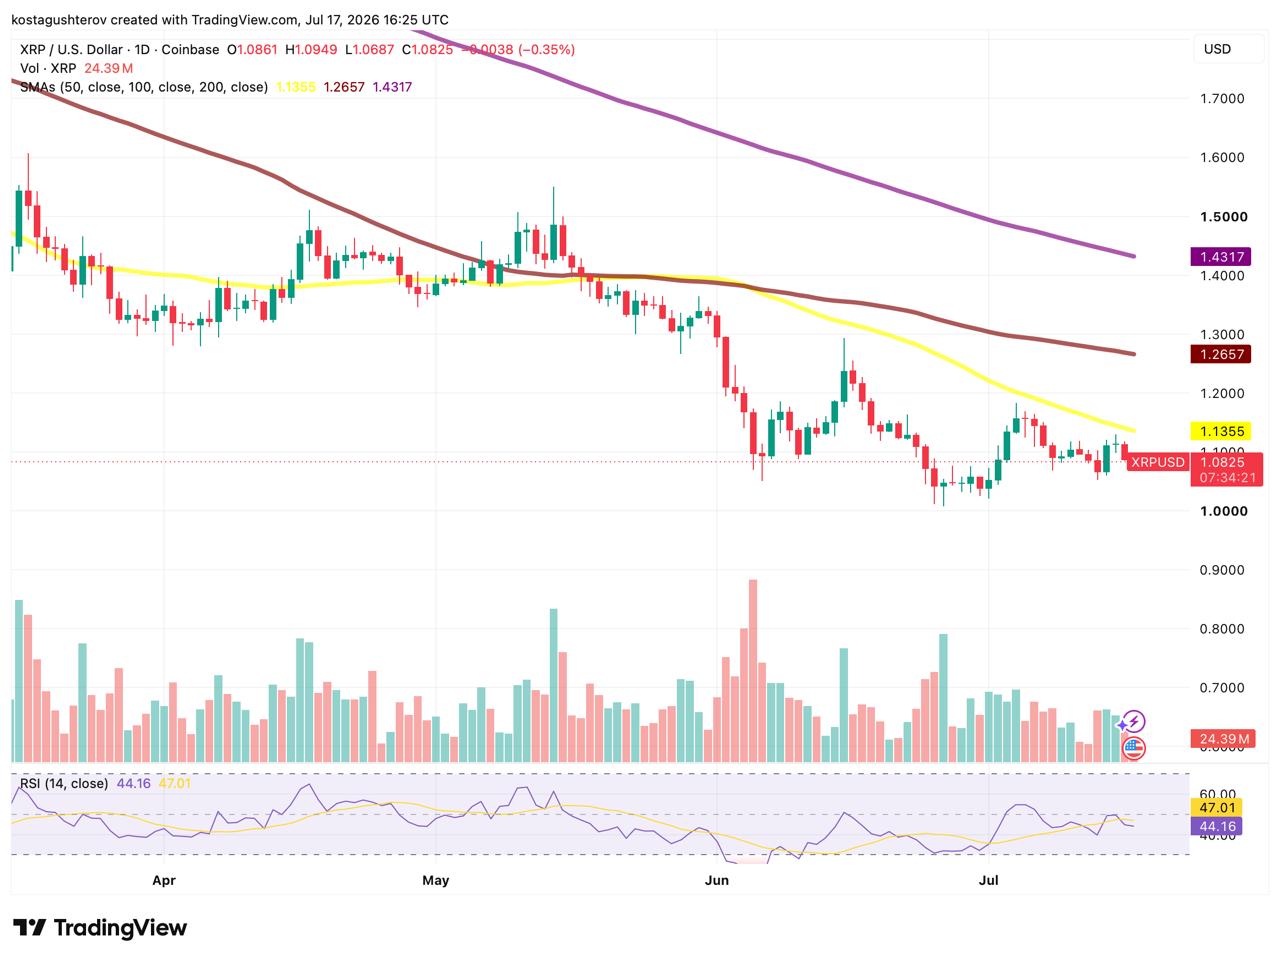
The three major daily moving averages are aligned above the current price:
Moving Average Resistance
All three are declining. The 50-day SMA approached the 100-day average in late May but failed to complete a bullish crossover, with the two lines separating again as price weakened.
The sequence of lower highs reinforces that structure. XRP peaked near $1.55 in April, failed around $1.50 on the following recovery, reached approximately $1.3 on June 15, and then stalled near $1.18 in early July.
Daily RSI has fallen to 44 after reaching approximately 58 during the latest bounce. It is now below its moving average at 47, showing that momentum weakened before reaching overbought conditions.
The two oversold readings recorded in early and late June produced only temporary recoveries. Volume has also faded to approximately 24.39 million, with no clear accumulation pattern behind the July advance and the more prominent recent spikes occurring during selling.
The $1.03-$1.05 Shelf Defines the Next Break
Buyers defended the $1.03-$1.05 area around June 5, again between June 25 and 27, and during the early-July decline. Below it, the cycle-low wick sits between $1.01 and $1.02, followed by the untested psychological level at $1.
Immediate resistance begins at the July 17 high near $1.09 and the July 14-15 wick area between $1.11 and $1.12. The declining 50-day SMA at $1.13 remains the more important ceiling because it stopped the latest recovery.
The narrowing range creates three measurable outcomes:
The prevailing trend, weakening RSI, and fading volume currently favor a bearish drift unless buyers recover the upper boundary.
Binance Leverage Is Approaching Its April Low
CryptoQuant analyst Darkfost highlighted a renewed decline in XRP’s estimated leverage ratio on Binance.
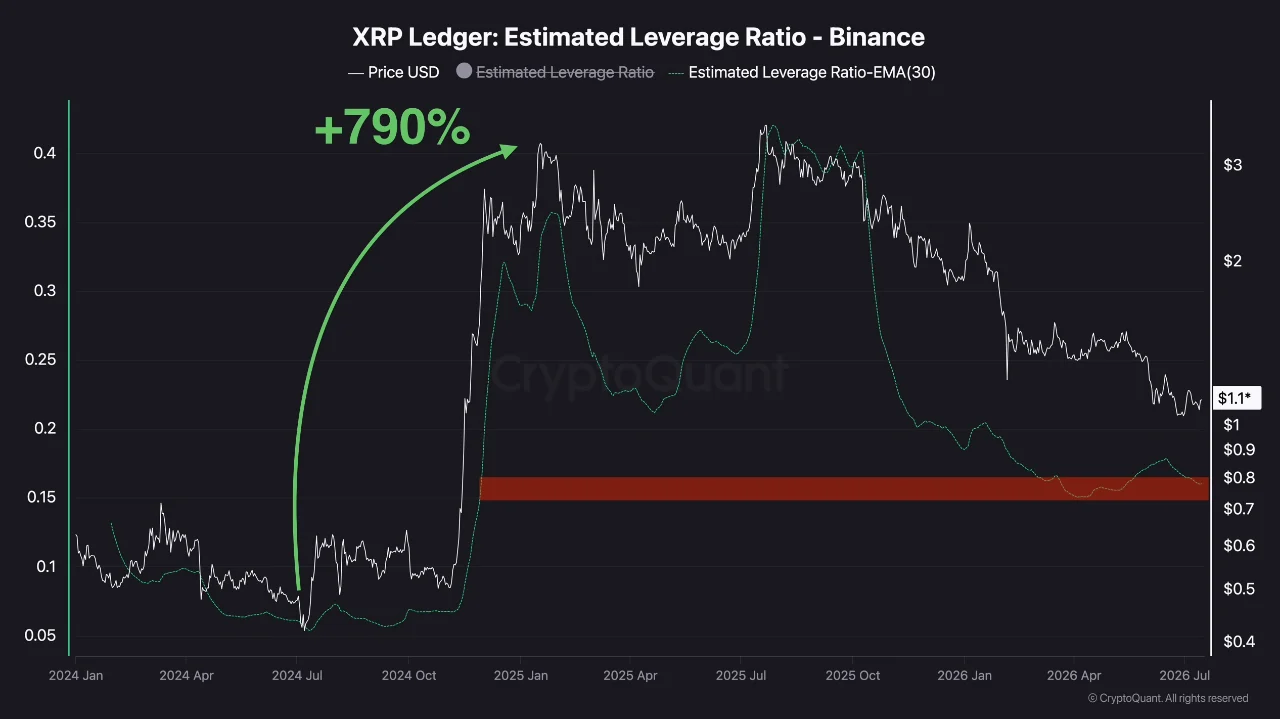
The metric compares derivatives open interest with the XRP reserves held on the exchange. A higher reading indicates that futures exposure is large relative to those reserves, while a lower reading points to reduced leveraged positioning.
XRP’s ratio currently stands at approximately 0.16, one of its lowest readings since November 2024 and close to the April 2026 low of 0.15.
The decline developed alongside a price correction of roughly 70%. Some futures positions were liquidated during the fall, while other traders closed exposure voluntarily, mechanically reducing open interest.
The all-exchange chart confirms that the reset extends beyond Binance. Total XRP open interest has fallen from approximately $3.8 billion earlier in the visible period to roughly $0.8 billion in the latest readings.
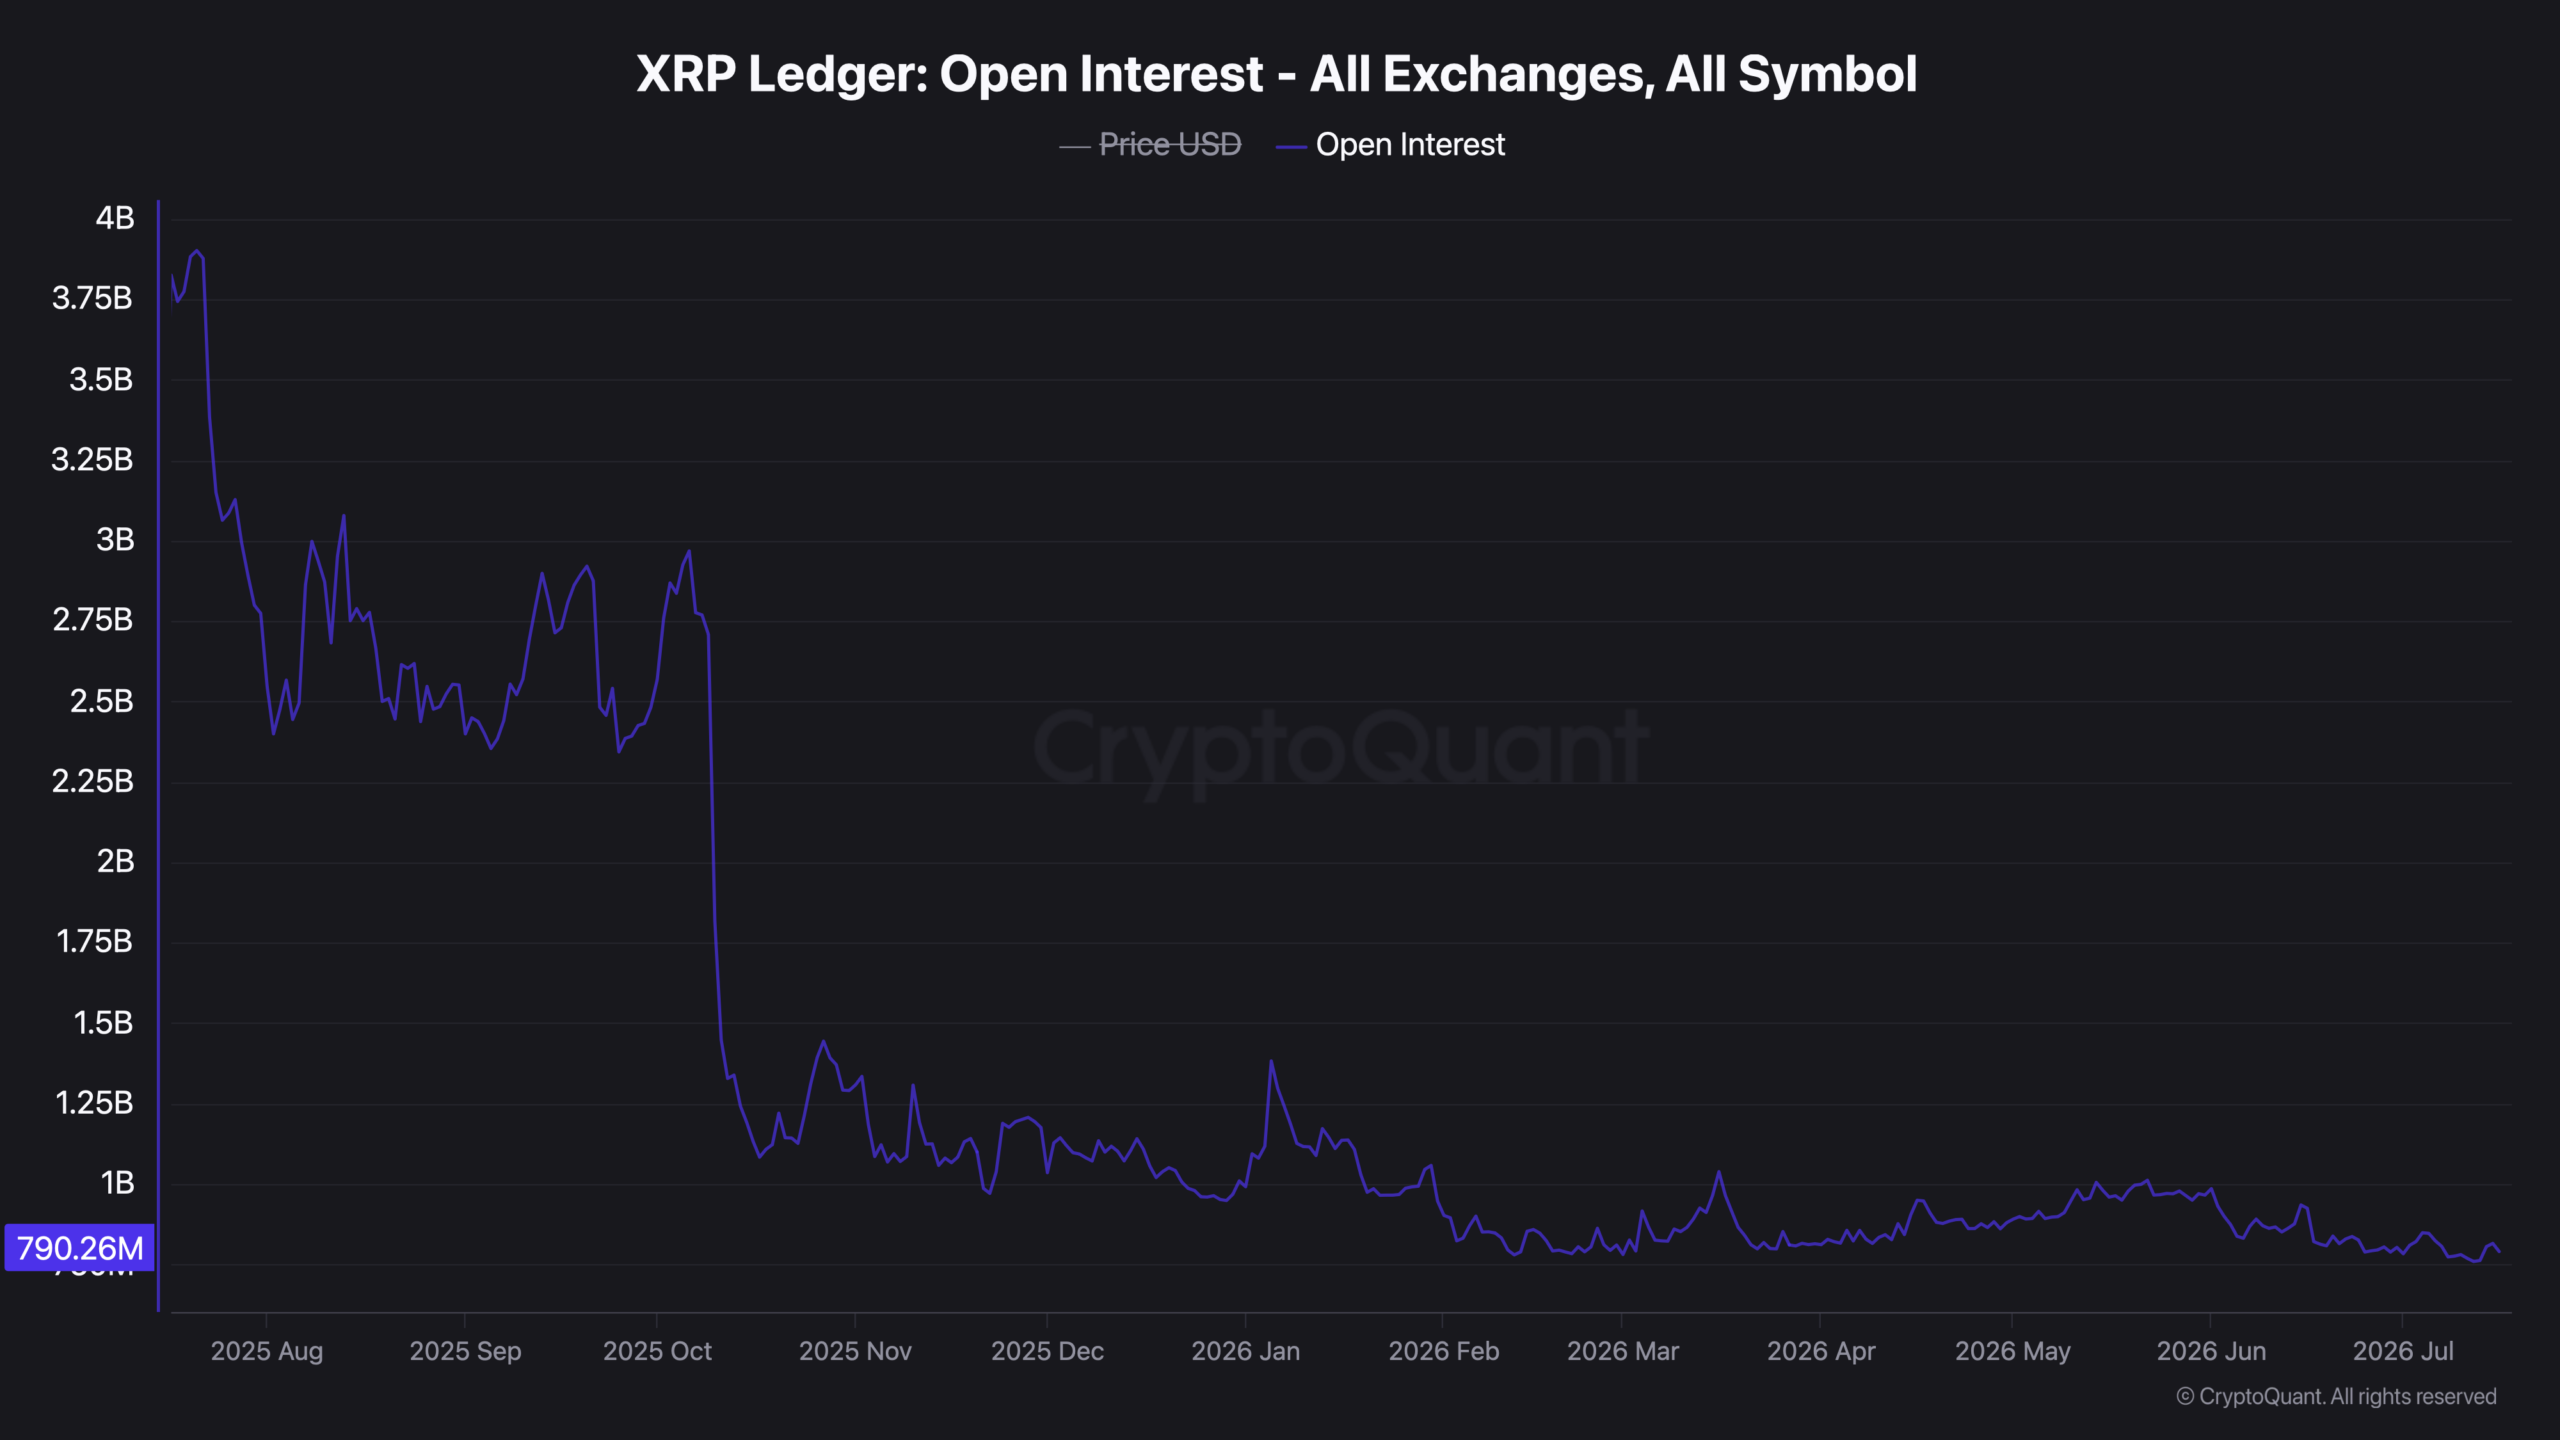
The derivatives market is therefore dominated by position reduction rather than sustained new leverage. Fewer outstanding positions reduce the fuel available for a liquidation cascade, although sharp price moves remain possible if support breaks or traders begin rebuilding exposure aggressively.
The contraction may also reflect weaker conviction and declining risk appetite. Deleveraging removes crowded positions; it does not reveal whether the next group of participants will be buyers or sellers.
The 2024 Reset Is a Precedent, Not a Forecast
Darkfost compared the current conditions with the deleveraging phase that developed in 2024.
XRP was then consolidating around $0.40 while Binance’s estimated leverage ratio approached 0.05. That cleanup preceded a rally of more than 790%, during which futures exposure returned and the leverage ratio climbed again.
The relevant similarity is the order of events: leveraged positions were removed before the next large directional move began.
The differences are equally important. The current ratio of 0.16 remains more than three times the 2024 low, while XRP is trading below a fully bearish moving-average structure with weakening momentum and no clear volume-based accumulation signal.
The earlier rally therefore demonstrates what can happen after a derivatives reset, not what must happen. A similar result would require renewed demand strong enough to reverse the lower-high sequence and rebuild participation without immediately recreating excessive leverage.
What the Derivatives Data Needs to Show Next
The behavior of open interest during the eventual range break will help determine the quality of the move.
If open interest continues drifting lower, the deleveraging process remains the dominant force regardless of short-term price fluctuations.
XRP now has a cleaner derivatives structure but an unresolved technical problem. The leverage reset becomes constructive only if price converts it into a break above the falling 50-day SMA; until then, the $1.03–$1.05 shelf remains the level preventing the bearish trend from extending toward $1.
The information provided in this article is for educational purposes only and does not constitute financial, investment, or trading advice.



Kosta has reported on cryptocurrency markets and blockchain infrastructure since 2020, bringing over six years of hands-on experience in the crypto industry built through daily tracking of markets, trends, and emerging blockchain developments. Specializing in Bitcoin on-chain analysis, institutional ETF flows, and digital asset price action, his work at Coindoo has been cited by other news agencies and consistently covers market developments with a focus on data-driven reporting across Bitcoin, Ethereum, Solana, and XRP. Over the years, Kosta has contributed to multiple crypto media outlets in different regions, authoring over 6,000 articles across the sector. His reporting spans cryptocurrency markets and the broader fintech industry, tracking not only price action but also the technological and regulatory forces shaping the ecosystem. To support his analysis, Kosta actively leverages on-chain data and metrics from leading platforms such as Santiment, Glassnode, and CryptoQuant, enabling deeper, evidence-based market insights. He believes in the power of transparency and the data that underpins the blockchain ecosystem. His academic background in Marketing Management from Denmark further complements his analytical approach, adding a strong understanding of communication strategy and content positioning to his work.