XRP Clawed Its Way Out of the $1 Zone – Now Comes the Hard Part

XRP gained roughly 16% over 24 hours and 24% on the week, ripping the token out of the $1 basement and slamming it directly into its first major technical wall. Trading around $1.25 after peaking at $1.26 during the session, the asset has punched back above a crucial floor, but the hard work starts right here.
Key Takeaways
- The next overhead hurdle stretches from the 0.5 Fib at $1.267 to the 200-day SMA at $1.276.
- CoinGlass metrics reveal that aggressive futures buying outpaced spot demand during the rally, placing a premium on defending $1.201 on any daily close.
- U.S. spot XRP ETFs logged $2.35 million in net inflows during the prior trading session.
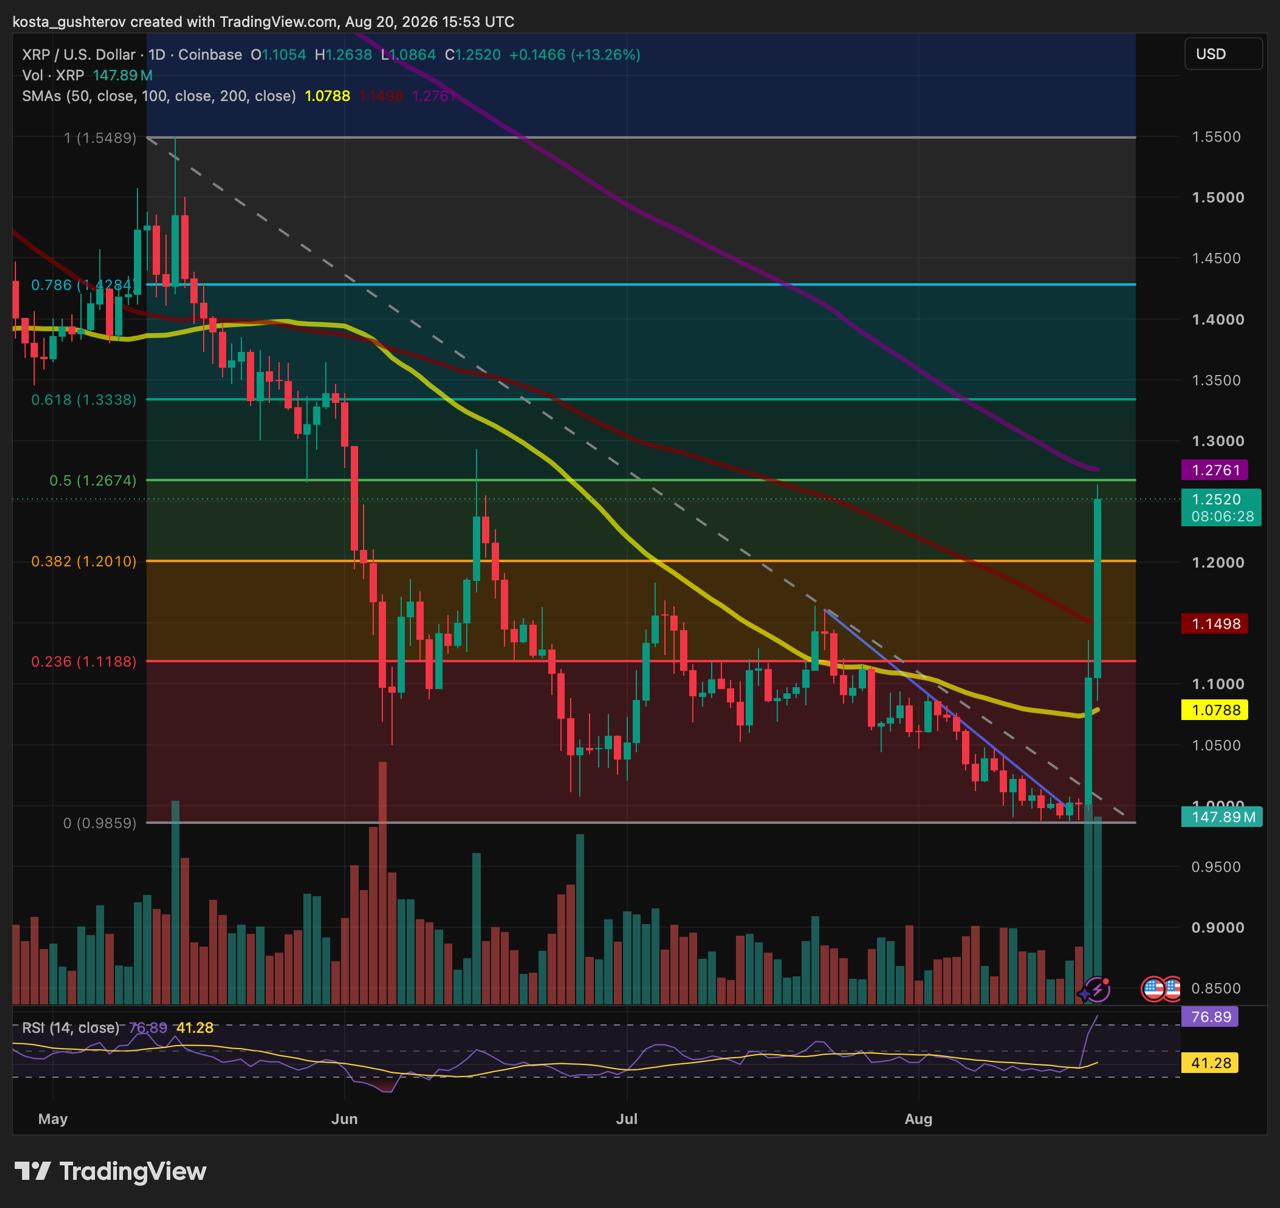
$1.2 is the close that could change the chart
Drawn from XRP’s $0.98 swing low to its $1.54 high, these Fibonacci levels carve the recent pullback into actionable zones. They aren’t crystal balls; their utility lies in marking the exact boundaries where a relief rally either builds a foundation or rolls over.
Snapping back above the 0.382 retracement at $1.2 is a win, but a daily close above that marker matters far more than an intraday flash through it. If buyers can cement a close over $1.2, that line transforms from a former ceiling into a possible safety net during pullbacks.
Slip back below it, and the breakout loses its teeth. XRP drifts back into the lower half of the range, looking less like a confirmed trend reversal and more like a violent dead-cat bounce off parity.
The next barrier is a zone, not one price
$1.267 and $1.276 form the immediate blockade
The 0.5 Fibonacci retracement rests at $1.267, sitting right on top of the 200-day SMA at $1.276. That heavy convergence gives the $1.27 neighborhood immense technical gravity.
The 200-day SMA averages out the past 200 daily closes, serving as the ultimate litmus test for the macro trend. A recovery that stalls out underneath it hasn’t actually fixed the broader downtrend. XRP doesn’t need to obliterate this hurdle in a single green candle, but bulls must prove sellers can’t continuously hammer the price back down.
Above it, $1.33 waits in the wings
Clear the $1.267-$1.276 barrier on a daily close, and the 0.618 Fibonacci level at $1.33 comes into view. That’s simply the next logical destination on the map, it only matters if buyers first secure acceptance above the 0.5 Fib.
Looking downward, the first line of defense is $1.2. Lose that, and the chart pivots to the 100-day SMA at $1.15, followed by the 0.236 retracement at $1.118. Deeper down, the 50-day SMA sits at $1.07, with August’s low near $0.98 acting as the ultimate line in the sand for the recovery.
Futures drove the bus, but spot needs to take the wheel
Peering under the hood of the order flow explains why traders are exercising caution near resistance. CoinGlass figures logged $20.30 million in positive XRP futures net flow over 24 hours, while spot markets ran a net negative of $2.56 million. During the peak 12-hour acceleration window, derivatives trading went into hyperdrive with $58.69 million in net inflows, compared to a modest $10.11 million positive spot reading.
That divergence matters. This wasn’t a slow, organic accumulation by cash buyers; it was a high-octane derivative push. While aggressive leverage can trigger powerful short squeezes, it also leaves the market vulnerable if leveraged longs capitulate right at major resistance.
CoinGlass tracks trade direction via market orders snapping up asks or hits on bids, it doesn’t differentiate between fresh longs or short covers. Even so, the message is clear: the urgency came from the futures pit.
The silver lining was the positive spot activity during the strongest 12-hour stretch. For this recovery to shake off its leverage-heavy reputation, spot buyers need to show up in force while XRP tests the $1.27 region.

ETF flows add a quieter source of demand
U.S. spot XRP ETFs chipped in $2.35 million in net inflows during the August 19 session, according to SoSoValue data. Bitwise led the pack with $1.19 million, followed by Franklin at $1.16 million.
While small change compared to derivatives volume, the distinction is vital. ETF purchases represent organic cash allocations via regulated wrappers. You can’t mash ETF tallies directly into CoinGlass order books, but consistent institutional inflows give the token structural ballast that pure derivatives hype simply can’t match.
What bulls must defend, and what sellers want to reclaim
- Bulls need a daily close above $1.2: Holding the 0.382 Fib keeps the rebound structurally intact.
- Bulls need acceptance above $1.27: A fleeting wick past the 0.5 Fib or 200-day SMA doesn’t cut it, the market needs a confirmed close followed by a successful retest.
- Sellers need XRP back below $1.201: Dragging the price under that floor drags $1.15 and $1.11 back into play.
- Spot demand is the ultimate litmus test: Leverage can punch through resistance, but spot accumulation is what makes prices stick.
XRP’s bounce off the $1 floor is impressive, but the easy part is over. Now comes the real test: turning raw momentum into structural acceptance, starting with a daily close over $1.201 and a clean break of the $1.27 resistance cluster.
The article is provided for informational purposes only and does not constitute investment advice.



Alex is Editor-in-Chief of Coindoo and co-founder of Millennial Media Group, with nearly a decade of experience covering financial markets - crypto first, then everything else. It started in 2016 with Bitcoin. Like most people at the time, he didn't fully understand it - so he kept digging. Blockchain, tokenomics, the projects, the cycles. That curiosity never stopped, and eventually pulled him into traditional markets too: equities, commodities, macro. Not because he left crypto behind, but because you can't properly understand one without the other. What drives him is straightforward: he wants to know why something is happening, not just that it's happening. Most market coverage stops at the headline - price up, price down, here's a chart. Alex finds that kind of reporting actively unhelpful. If you walk away from an article without understanding the mechanism behind the move, what did you actually learn? He holds a degree in Tourism from New Bulgarian University - not the most obvious path into financial markets, but markets have a way of pulling in people who are simply too curious to stay out. He has authored over 200 in-depth analyses and more than 10,000 articles across crypto and traditional finance. He still thinks every day in markets teaches him something new. That's probably why he hasn't stopped.