Uniswap Jumps 27% – Important Levels to Watch Next
Uniswap gained nearly 27% in 24 hours and 38% over seven days, reaching $8.8. A pullback toward $7.5 would provide the breakout’s first support test.
Key Takeaways
- UNI gained almost 38% over seven days.
- Price reached a local high near $8.85.
- The first Fibonacci retracement sits near $7.50.
- Shorts dominated the tracked liquidations.
UNI pushes above its September high after buyers defend $6
Uniswap traded near $8.50 at 06:33 UTC on September 18 after gaining 26.9% over 24 hours and almost 38% over seven days, according to CoinMarketCap.

The current candle on the Coinbase UNI/USD daily chart was up approximately 9%. That does not conflict with the larger 24-hour figure: the daily candle measures the change from the session open, while the rolling calculation begins earlier and includes part of the previous session.
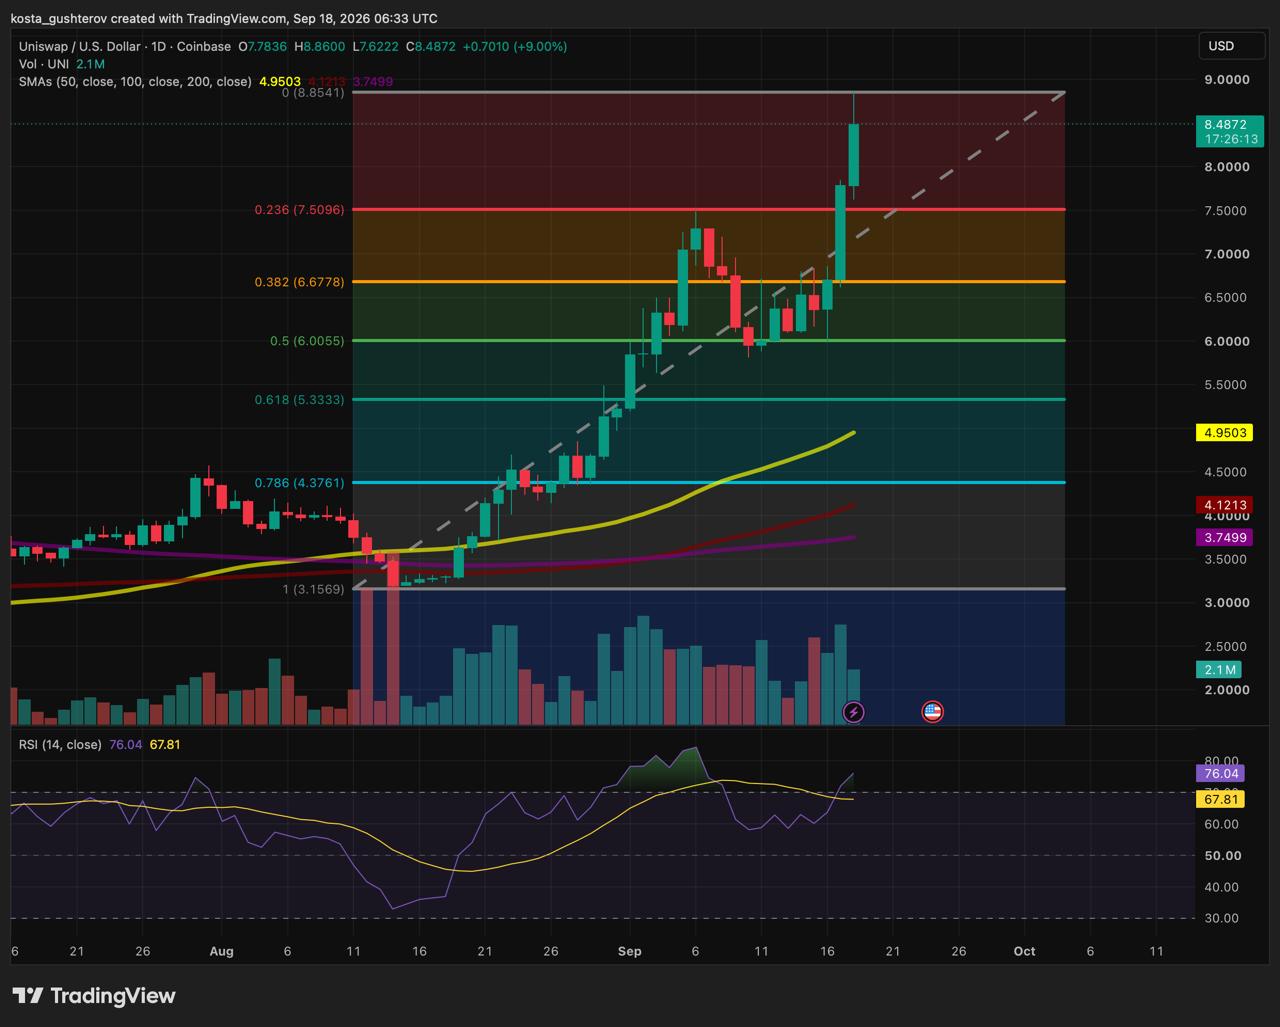
UNI’s recovery started near $3.15 in mid-August. The first advance carried the price into the low-$7 range before sellers pushed it back toward $6. Buyers returned there, and UNI spent the following sessions moving mainly between $6 and $6.70.
That range broke during the latest advance. UNI cleared its earlier September high and reached $8.85 before easing toward $8.50. The daily session had not closed, so $8.85 remained an intraday high rather than a confirmed closing breakout.
The $8.85 high defines the Fibonacci levels
The Fibonacci retracement shown on the chart is measured from the August low near $3.15 to the new local high around $8.85. Because that upper point formed during the latest rally, these levels could not have predicted UNI’s earlier reactions.
From here, the levels show how much of the rally UNI might surrender during a correction. The $6.70 level overlaps with the former range ceiling, while $6 coincides with the area buyers defended during the previous decline.
The $7.50 level has not yet been tested after the high formed, so it is potential support rather than an established floor. Below it, $6.70 and $6 already have visible trading history behind them.
Recent Uniswap releases preceded the rally
Uniswap Labs announced on September 16 that Uniswap v2, v3, v4 and UniswapX had gone live on Arc, Circle’s Layer 1 network for stablecoin finance. Uniswap became a preferred decentralized exchange on the network from launch, with access through its Web App, Wallet and API.
According to the official announcement, Uniswap has processed $2.7 trillion in stablecoin volume since 2020, including approximately $2 trillion in USDC. Arc provides another distribution channel in a market where the protocol already handles substantial volume.
Uniswap Labs also published technical details about its StablePair Hook. The Uniswap v4 mechanism adjusts fees according to how far a stable-asset pool moves from its reference price. Its purpose is to retain more of the value generated during rebalancing for liquidity providers.
Uniswap already supports restricted tokenized markets
The SEC’s September 17 order has a more direct connection to Uniswap than a general improvement in crypto regulation. Since June, eligible users have been able to discover and trade tokenized versions of securities, including Apple, Tesla and Nvidia, through the Uniswap Web App, Wallet and API.
Uniswap v4 also has a live Permissioned Pools standard for regulated assets. Issuers can require approved wallets, check participants before each swap, apply separate rules to liquidity providers and pause trading through their compliance systems. Those restrictions apply to the individual pool; the underlying Uniswap protocol remains permissionless.
These tools resemble one part of the SEC framework. Under the agency’s Innovation Exemption, a Tokenized Securities Venue must restrict access to approved participants. The venue must also be a U.S. person, comply with sanctions requirements, respect issuer objections and use tokenized shares carrying the same rights as the corresponding traditional stock.
The order does not approve Uniswap or automatically place every tokenized asset available through its interfaces inside the exemption. Any operator using Uniswap infrastructure would still need to satisfy the SEC’s conditions.
Arc and StablePair were direct Uniswap developments, while the SEC order affected the wider onchain-securities market. All arrived close to the rally, but the available data cannot show how much buying each produced. None creates an automatic requirement to buy UNI.
Short liquidations accompanied the breakout
Liquidation trackers monitor different exchanges, so their totals do not match. Gate provides a useful directional breakdown: when checked at 06:46 UTC on September 18, its UNI tracker showed $2.05 million in liquidations over 24 hours.
Short positions accounted for $1.81 million of that amount, compared with approximately $240,000 in liquidated longs. Shorts therefore represented about 88% of the liquidations captured by Gate.
CoinGlass, which aggregates a different set of venues, recorded approximately $7.7 million in total liquidations. It also reported about $2.05 billion in futures volume, $386 million in spot volume and $713 million in open interest.
The imbalance confirms that forced short closures occurred during the advance and likely added momentum after UNI cleared its previous high. It does not show that liquidations caused the entire rally.
Futures turnover was more than five times CoinGlass’s tracked spot volume, confirming that derivatives activity was substantial. It does not show whether newly opened positions were predominantly long or short.
Momentum is strong, but UNI is far above its averages
Daily RSI reached approximately 76. The indicator measures the speed and size of recent price changes, so the reading shows how quickly UNI has advanced. It does not determine when the rally must end.
UNI was also trading more than 70% above its 50-day moving average near $4.95. The 100- and 200-day averages were lower, near $4.12 and $3.75.
The 50-day average sits above the 100-day average, which remains above the 200-day average, and all three are rising. That supports the wider recovery, although the averages are too far below price to guide the immediate setup.
What the next move would indicate
Above $8.85: A daily close above the local high would extend the breakout. The displayed period contains no tested resistance above it, so a longer-term chart would be needed before identifying another defensible level.
A pullback to $7.50: This would test whether the 23.6% retracement can act as support. A sustained reaction above it would leave UNI outside its previous range.
Below $7.50: Attention would shift to $6.70, where the Fibonacci measurement overlaps with the former consolidation ceiling.
Below $6.70: The $6 area would become the more important test because buyers stopped the previous decline there.
The first pullback could answer the main question
UNI has already shown that buyers can push the price through its earlier September high. What remains unclear is whether demand will persist after forced short closures fade and early buyers begin taking profits.
The first correction should provide that evidence. Remaining outside the former $6-$6.70 range would preserve the improved structure, while falling back into it would show that the latest acceleration moved faster than its underlying support.
This article is provided for informational purposes only and does not constitute financial or investment advice. Cryptocurrency prices, technical indicators and liquidation data can change rapidly.



Kosta has reported on cryptocurrency markets and blockchain infrastructure since 2020, bringing over six years of hands-on experience in the crypto industry built through daily tracking of markets, trends, and emerging blockchain developments. Specializing in Bitcoin on-chain analysis, institutional ETF flows, and digital asset price action, his work at Coindoo has been cited by other news agencies and consistently covers market developments with a focus on data-driven reporting across Bitcoin, Ethereum, Solana, and XRP. Over the years, Kosta has contributed to multiple crypto media outlets in different regions, authoring over 6,000 articles across the sector. His reporting spans cryptocurrency markets and the broader fintech industry, tracking not only price action but also the technological and regulatory forces shaping the ecosystem. To support his analysis, Kosta actively leverages on-chain data and metrics from leading platforms such as Santiment, Glassnode, and CryptoQuant, enabling deeper, evidence-based market insights. He believes in the power of transparency and the data that underpins the blockchain ecosystem. His academic background in Marketing Management from Denmark further complements his analytical approach, adding a strong understanding of communication strategy and content positioning to his work.