Trump Locks In Venezuelan Gold Deal as Spot Prices Slide Below $5,100

The Trump administration has finalized a multimillion-dollar agreement to export up to 1,000 kilograms of Venezuelan gold into U.S. markets, even as spot gold prices retreat sharply from January's record highs.
Key Takeaways
- Trump administration brokers Venezuelan gold export deal worth $150–160M to U.S. markets
- Spot gold has dropped below the critical $5,100 level, trading near $5,081 as of March 5
- RSI sits at 37.82 — approaching oversold territory; MACD remains deeply negative
- Analysts remain split: J.P. Morgan targets $6,300, while Citigroup sees downside to $3,600–$3,800
The deal pairs Venezuela’s state-owned miner Minerven with commodities trader Trafigura, with volumes ranging between 650 and 1,000 kilograms of gold doré bars at 98% purity. At roughly $166,000 per kilogram, the transaction is valued at upward of $150–160 million. The U.S. Treasury’s Office of Foreign Assets Control is issuing a license to enable the deal, and Trafigura will move the shipment to American refineries under a separate arrangement with Washington.
This marks the third extraction contract signed since the U.S. effectively assumed control of Venezuelan resource operations following the January 2026 capture of former President Nicolás Maduro. An interim government under Delcy Rodriguez has since cooperated closely with Washington — Rodriguez publicly pledged Venezuela would move at “Trump speed” in unlocking the country’s mineral wealth. Trump, for his part, called the relationship between the two countries “a very nice thing to see” on Truth Social.
U.S. officials have framed the deal in part as a strategic redirection — gold that previously flowed to Turkey and Iran will now head stateside. Interior Secretary Doug Burgum traveled to Caracas earlier this year to facilitate the arrangement alongside broader mining reform discussions. Trafigura already handles over $1 billion in U.S.-Venezuela oil transactions, making this gold deal an extension of a deepening commercial relationship.
Venezuela holds an estimated 161.2 metric tonnes of gold reserves, valued at over $23 billion at current prices — a reserve base that Washington appears intent on tapping further.
Gold Markets: Sharp Pullback as Macro Headwinds Intensify
The geopolitical intrigue surrounding the Venezuela deal is playing out against a deteriorating technical picture for gold. Spot prices have fallen to approximately $5,081 per ounce as of March 5, down from a record high near $5,608 set in late January. The metal is off roughly $61 from its intraday peak earlier this week and has now broken below the psychologically significant $5,100 level.
The selloff is not being driven by a single factor. A surging U.S. dollar — the DXY climbed to a six-week high near 99.2 — has made gold more expensive for international buyers. Meanwhile, the 10-year Treasury yield pushed above 4%, raising the opportunity cost of holding non-yielding assets. Escalating oil prices, tied to renewed tensions involving Iran, have stoked inflation fears and led markets to price out early Federal Reserve rate cuts — a shift that historically weighs on gold.
Morgan Stanley analysts have suggested some of the selling reflects forced liquidation rather than a fundamental change in sentiment, as investors raise cash during periods of market stress. Exchanges raising margin requirements have added fuel to the mechanical unwind of what had become a heavily crowded bullish position.
Despite the recent pullback, gold remains up approximately 18% year-to-date in 2026 — a figure that underscores just how aggressive the January rally was.
Analyst Forecasts Remain Widely Divergent
Wall Street is far from aligned on where gold goes from here. J.P. Morgan has set a $6,300 target, calling recent weakness a buying opportunity within a broader “reserve currency paradigm shift.” UBS is similarly bullish at $6,200, with an upside scenario of $7,200 should geopolitical risks intensify. Goldman Sachs sits at $5,400, pointing to structural demand from Western ETFs and family offices.
On the other side of the ledger, Citigroup projects a range of $3,600–$3,800 over the next six to twelve months, reflecting a neutral-to-bearish stance. deVere Group has flagged risks around overcrowded positioning and potential central bank reserve liquidation. A Reuters poll of 30 analysts produced a median 2026 forecast of $4,746.50 per ounce — well below current trading levels.
Central bank demand remains a key support variable. Purchases are projected at 750–1,100 tonnes through 2026, which many bulls argue provides a structural floor even in the event of further price weakness.
The next major test for gold will come with U.S. jobs data on March 6. A strong print would likely reinforce dollar strength and push prices toward the $5,000 support level. Below that sits the 200-day moving average near $4,850 — a level few bulls want to see tested.
Technical Analysis – Gold Spot / USD (4H)
The 4-hour chart presents a clear bearish picture in the near term. Price is currently sitting at $5,081, caught between the SMA 50 at $5,201 and the SMA 100 at $5,102 — both of which now act as overhead resistance after price broke down through them in recent sessions. The inability to reclaim even the SMA 100 is a meaningful short-term negative.
The RSI (14) reads 37.82, with the signal line at 42.35. While not yet in oversold territory, momentum is pointed lower and the gap between the two lines suggests continued selling pressure without an obvious reversal signal yet.
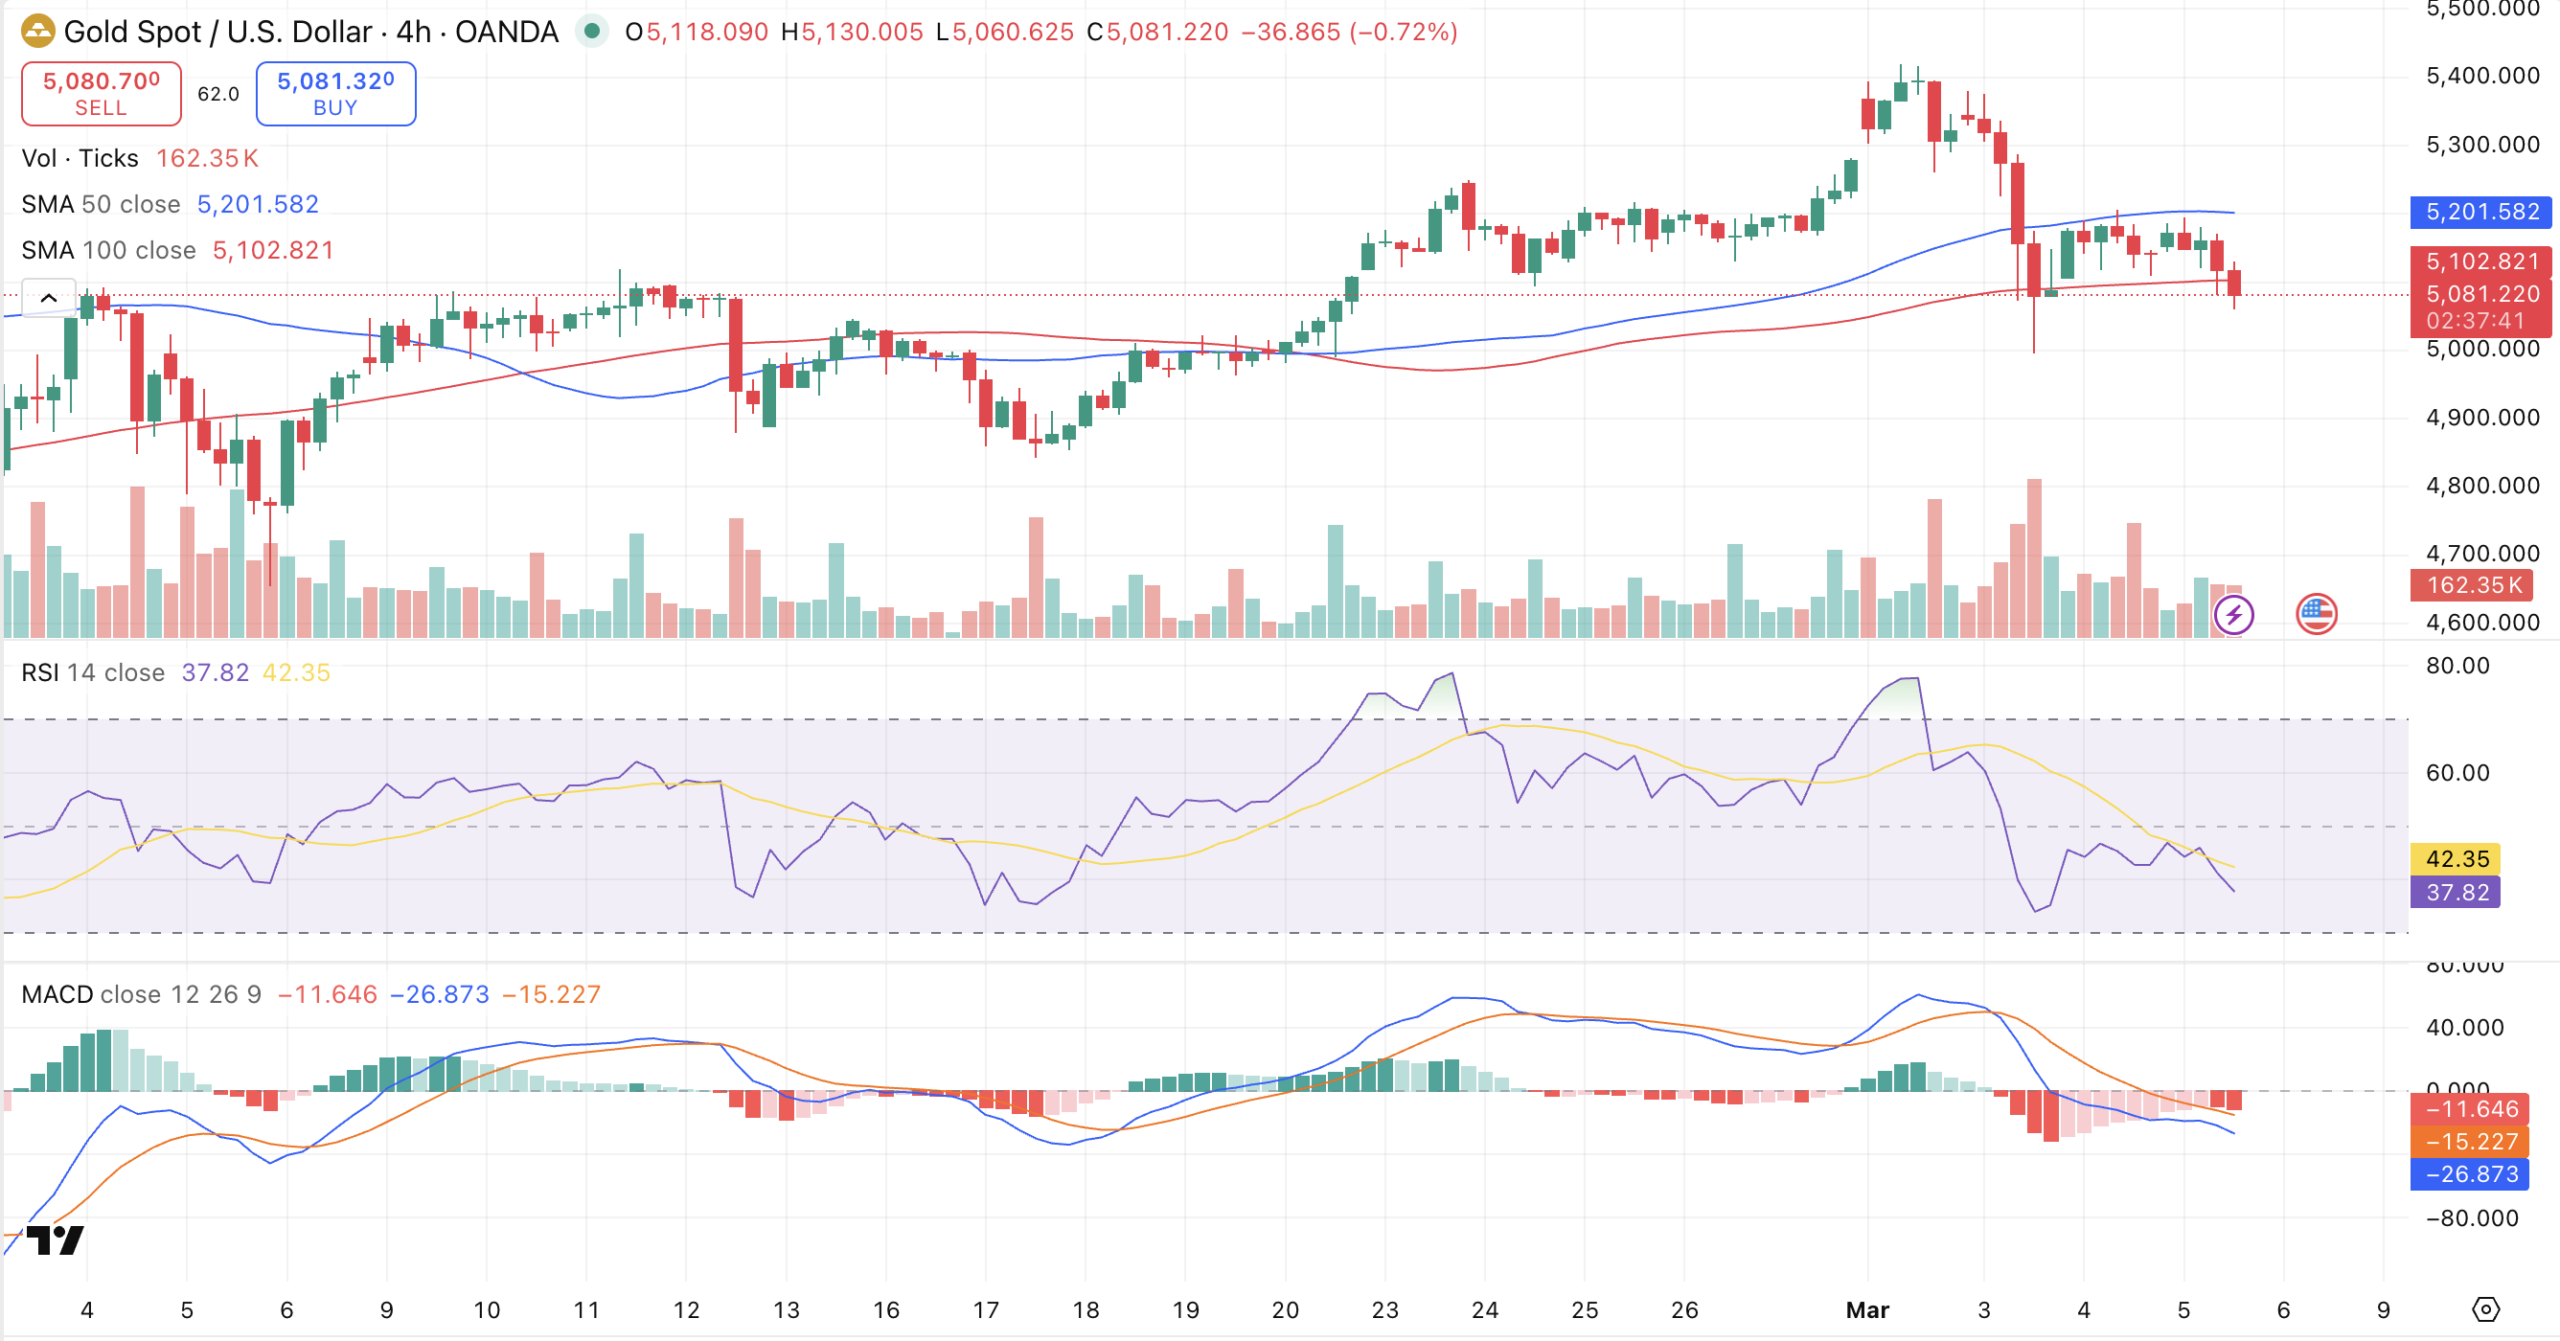
The MACD reinforces the bearish case. The MACD line sits at -11.646, below the signal at -15.227, with the histogram at -26.873. All three readings are deeply negative, and the histogram has shown no clear sign of compression – suggesting the downtrend has further to run before exhaustion sets in.
Volume has picked up on recent red candles, consistent with a distribution phase rather than a low-conviction pullback. For bulls to regain control, price needs to reclaim $5,100 with conviction – ideally followed by a clean break above $5,200 to challenge the broader downtrend. Failure to do so keeps the door open to a test of $5,000, and potentially the $4,850 zone where the longer-term moving average rests.
The information provided in this article is for educational purposes only and does not constitute financial, investment, or trading advice. Coindoo.com does not endorse or recommend any specific investment strategy or cryptocurrency. Always conduct your own research and consult with a licensed financial advisor before making any investment decisions.

Alex is an experienced financial journalist and cryptocurrency enthusiast. With over 8 years of experience covering the crypto, blockchain, and fintech industries, he is well-versed in the complex and ever-evolving world of digital assets. His insightful and thought-provoking articles provide readers with a clear picture of the latest developments and trends in the market. His approach allows him to break down complex ideas into accessible and in-depth content. Follow his publications to stay up to date with the most important trends and topics.