Solana Price Finds Support near $95: Can It Hold?

Solana is testing the lower edge of a descending daily channel near $95, while the Fed decision, leveraged positioning and ETF flows shape whether support survives.
Key Takeaways
- SOL is testing overlapping support near $95.
- SOL must reclaim $101-$103 to break out.
- Fed guidance may matter more than the hike.
- Leveraged trading could amplify the next move.
- ETF inflows remain positive but modest.
SOL has reached two forms of support at $95
SOL traded near $97.5 at 13:10 UTC on September 16 after testing the lower boundary of the descending channel visible on the daily chart. That boundary overlaps the 38.2% Fibonacci retracement at approximately $95, measured from the $70 low to the $110 high.
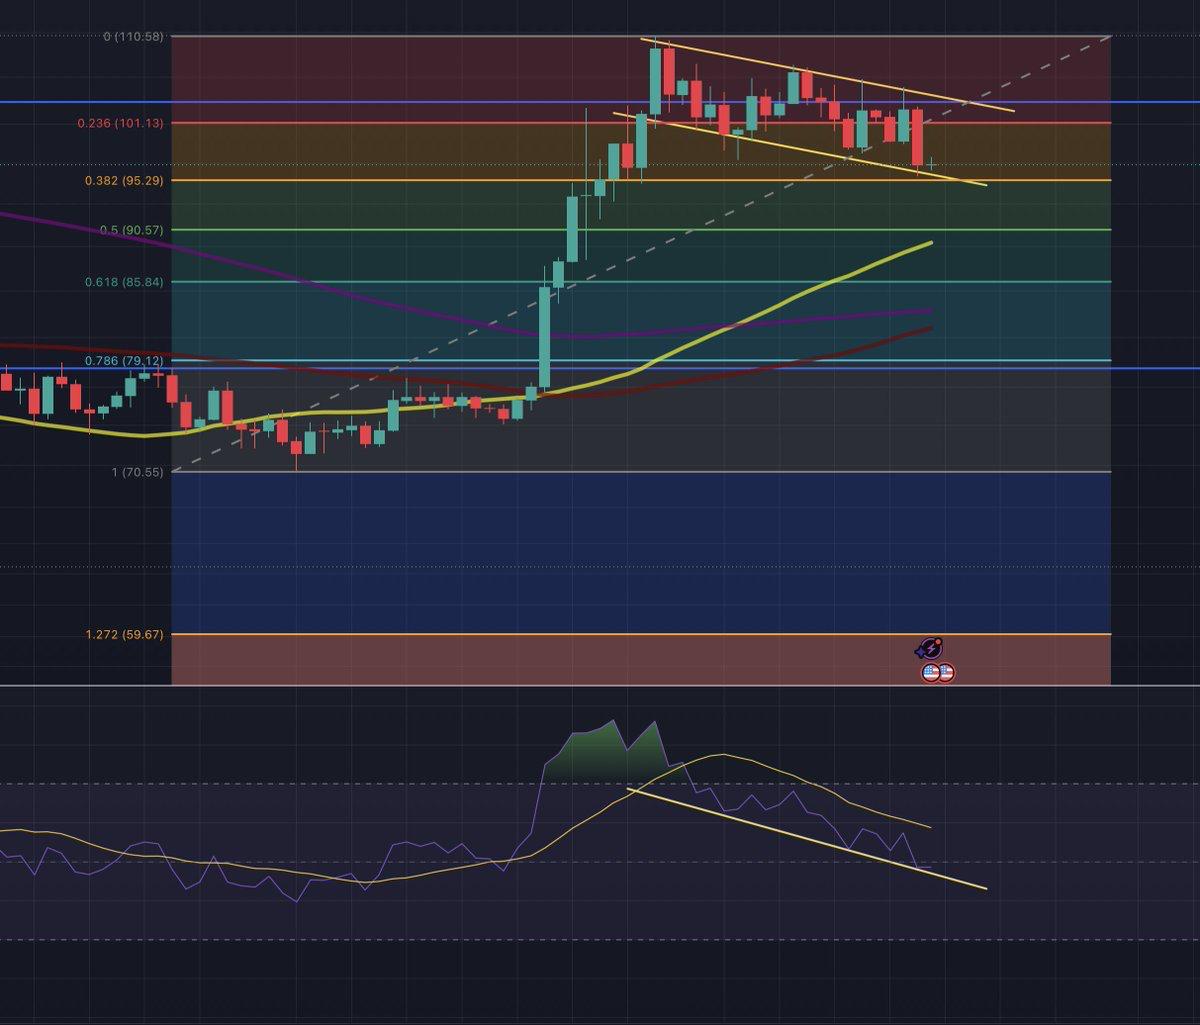
The overlap gives the area more technical relevance than either level would have on its own. The channel boundary tracks the current sequence of lower highs and lower lows, while the Fibonacci level measures how much of the previous rally SOL has surrendered.
The latest pullback coincided with the Senate’s failure to advance the Digital Asset Market CLARITY Act. The bill fell short of the 60 votes required to move forward, contributing to a broader decline across crypto markets.
Momentum has not yet confirmed a recovery. The relative strength index shown beneath the chart remains inside its own descending structure. Price holding near support while momentum continues to weaken can produce a temporary bounce, but it does not establish that the correction has ended.
A $95 hold still needs a $101-$103 reclaim
SOL remains inside the channel until price closes through one of its boundaries. The levels below define what would confirm a recovery or extend the correction.
An intraday move through either boundary would be less meaningful than a daily close. SOL has already crossed nearby levels during volatile sessions without establishing a lasting direction. Closing outside the channel would provide stronger evidence that traders have accepted prices beyond its current range.
The Fed’s outlook could decide whether support survives
The Federal Reserve will publish its decision at 2:00 p.m. ET, or 18:00 UTC. At 13:10 UTC on September 16, the CME FedWatch Tool showed a 92.7% implied probability of a 25-basis-point rate increase. The hike is largely expected; the potential surprise lies in the projected path for rates after September.
If policymakers indicate that additional increases are likely, Treasury yields and the dollar could rise as investors adjust to tighter financial conditions. That would make it harder for SOL to recover from the lower edge of its channel because higher yields tend to reduce demand for assets without predictable cash flows.
A hike accompanied by softer guidance would create a different setup. If the Fed suggests that future decisions will depend on incoming data or that the tightening cycle is near its end, traders could treat the announcement as less restrictive than feared. SOL would still need to clear the channel ceiling, but the macro pressure behind the recent decline could ease.
SOL’s futures market could magnify the reaction
The size of SOL’s futures market could amplify whichever reaction follows the Fed announcement. At the same 13:10 UTC check, CoinGlass showed approximately $5.88 billion in open interest, $8.57 billion in futures volume and $912 million in spot volume.
With futures turnover more than nine times reported spot volume, leveraged trading can make SOL’s reaction to the Fed faster and more volatile. About $23 million in SOL futures positions had been liquidated over 24 hours during the decline.
The recent drop forced some leveraged positions out of the market, but open interest alone cannot show whether the remaining positions are vulnerable. It includes both long and short exposure and does not reveal where individual liquidation prices sit.
A break below support accompanied by rising open interest and long-heavy funding would provide stronger evidence that new leveraged bets are increasing downside risk. Falling open interest during a decline would instead suggest that traders are reducing exposure rather than building fresh positions.
ETF inflows offer a smaller counterweight
Solana investment products tracked by Farside Investors recorded net inflows of $11 million on September 14 and $1.3 million on September 15.
The two positive sessions show that buyers continued adding exposure during the pullback, although the latest inflow was small. Several more sessions are needed before the data can show whether demand is strengthening or merely remaining positive.

Transaction V1 expands what applications can place onchain
Solana also activated Transaction V1, which raises the maximum transaction size from 1,232 to 4,096 bytes. Applications that adopt the format can include more instructions, signatures and cryptographic data in one transaction.
The additional capacity can help with multisignature approvals, batched operations and zero-knowledge proofs that were difficult to fit within the previous limit. It may also reduce the need for applications to divide one complex action into several separately signed transactions.
Its price relevance depends on whether developers adopt the format for transactions that could not fit inside the old limit. The upgrade expands what applications can do; it does not create immediate SOL demand on its own.
The $95 close comes first
The immediate question is whether SOL remains above the lower channel boundary after the Fed volatility passes. Holding it preserves the rebound attempt; escaping through the upper boundary would end the current sequence of lower highs.
ETF inflows and Transaction V1 operate on a longer horizon. They can support the wider case for SOL only if investment demand and application activity persist after the immediate macro event.
This article is provided for informational purposes only and does not constitute financial or investment advice. Cryptocurrency prices, ETF flows, derivatives data and interest-rate expectations can change rapidly.



Kosta has reported on cryptocurrency markets and blockchain infrastructure since 2020, bringing over six years of hands-on experience in the crypto industry built through daily tracking of markets, trends, and emerging blockchain developments. Specializing in Bitcoin on-chain analysis, institutional ETF flows, and digital asset price action, his work at Coindoo has been cited by other news agencies and consistently covers market developments with a focus on data-driven reporting across Bitcoin, Ethereum, Solana, and XRP. Over the years, Kosta has contributed to multiple crypto media outlets in different regions, authoring over 6,000 articles across the sector. His reporting spans cryptocurrency markets and the broader fintech industry, tracking not only price action but also the technological and regulatory forces shaping the ecosystem. To support his analysis, Kosta actively leverages on-chain data and metrics from leading platforms such as Santiment, Glassnode, and CryptoQuant, enabling deeper, evidence-based market insights. He believes in the power of transparency and the data that underpins the blockchain ecosystem. His academic background in Marketing Management from Denmark further complements his analytical approach, adding a strong understanding of communication strategy and content positioning to his work.