SHIB Rally Hits a Wall as Whale Activity Spikes

SHIB reached major resistance after a two-day rally, as whale activity surged and social attention peaked near the top.
Key Takeaways
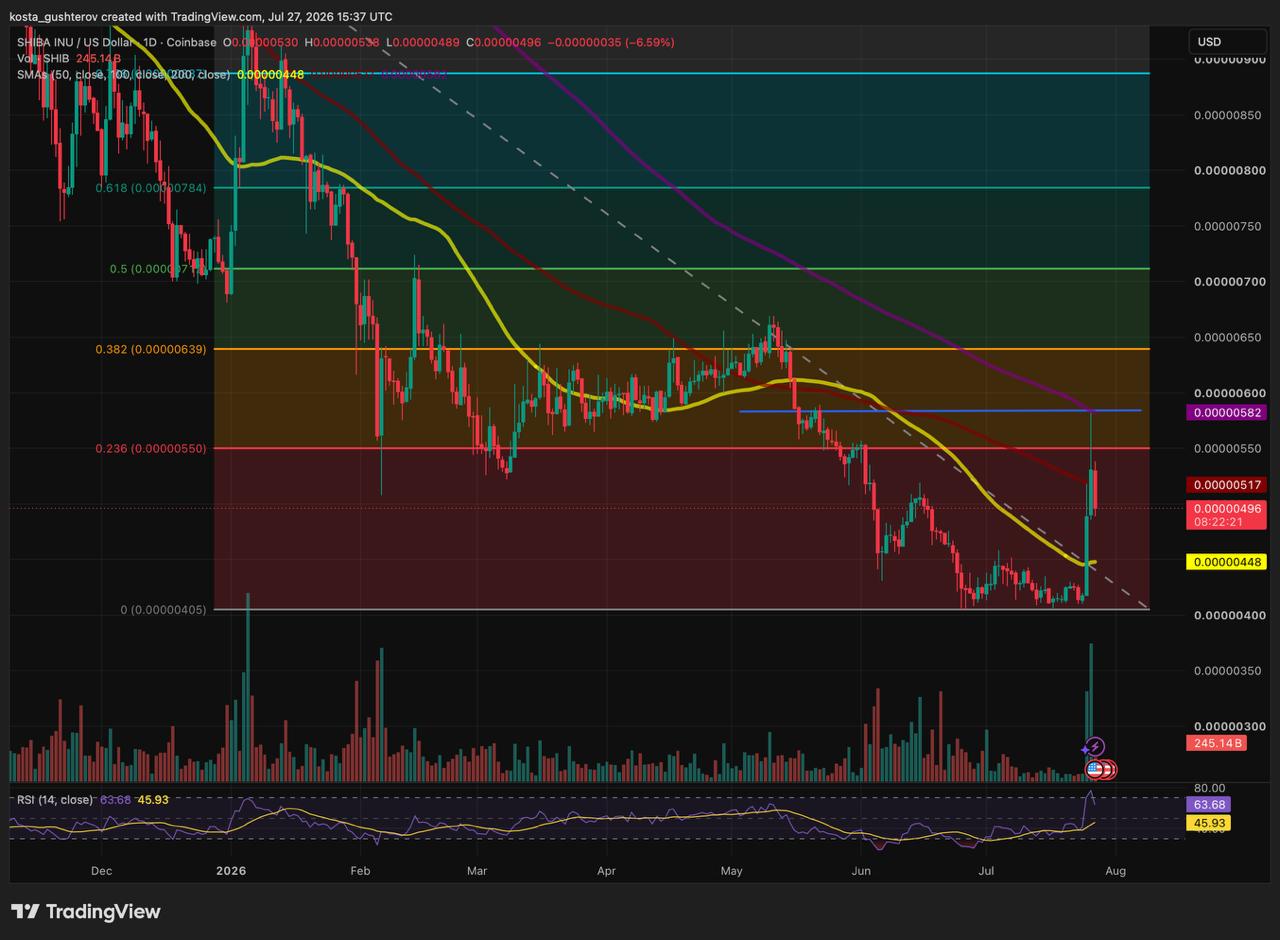
Shiba Inu’s two-day rally stopped exactly at the resistance highlighted in our July 26 analysis, as SHIB reached approximately $0.0000058, where its 200-day simple moving average meets the February consolidation high. Sellers responded immediately, confirming the area as a major resistance zone.
The token traded near $0.00000496 at the time of writing on July 27, down about 6.6% for the session after falling as low as $0.0000048. The daily candle remained open at the captured timestamp.
The Rally Reversed at Resistance
SHIB gained 18% on July 25, reclaiming its 50-day SMA and reaching the 100-day average. Another 15% advance on July 26 carried price through the 0.236 Fibonacci retracement near $0.0000055 before it reached the 200-day SMA.
The rejection pushed SHIB back below the 100-day SMA near $0.00000517 and the 0.236 Fibonacci level. Volume remained elevated at approximately 245 billion SHIB, showing that the pullback attracted significant activity.
Social Attention Arrived Near the Peak
Santiment reported that SHIB’s social dominance reached 0.084%, its highest level since April 2, after the token had already gained roughly 37% over two days.
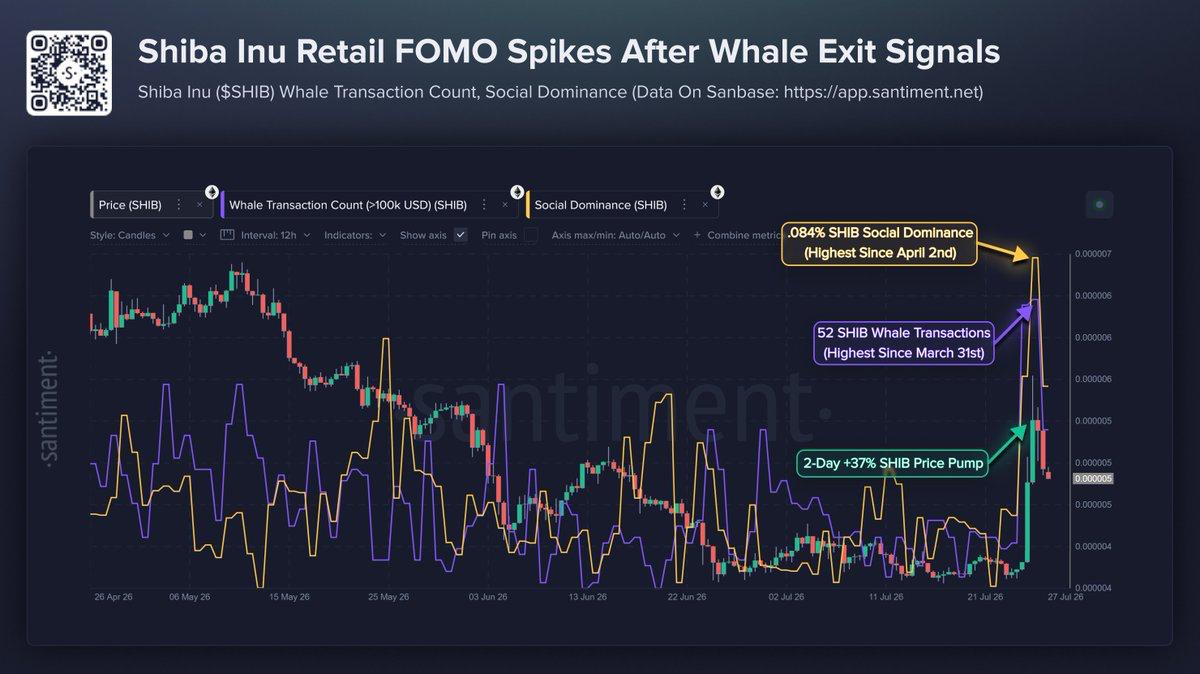
Social dominance measures an asset’s share of the wider crypto discussion. In this case, crowd attention accelerated after most of the price move had already occurred.
Santiment also recorded 52 SHIB transactions worth more than $100,000 in one day, the highest count since March 31. The activity increased as SHIB approached resistance, making profit-taking by larger holders possible.
However, transaction counts do not show whether the transfers were purchases, sales or movements between wallets. The data confirms increased whale activity near the top, but not outright distribution.
SHIB Has Lost Its First Support Area
The area between the 100-day SMA at approximately $0.00000517 and the 0.236 Fibonacci level at $0.0000055 was the first potential support after the breakout. SHIB had fallen below both levels at the time of writing.
Failure to recover that range would place the 50-day SMA near $0.0000044 back in focus. Below it, the wider breakout base between approximately $0.0000041 and $0.0000046 becomes the next important support area.
The first two sessions were supported partly by short liquidations and futures activity that exceeded spot volume. The decline suggests that some of that momentum is fading as traders lock in profits.
What Matters Next
SHIB now needs to recover the area between $0.00000517 and $0.0000055 to preserve the breakout structure. Continued trading below it would increase the risk of a deeper return towards the 50-day SMA and the previous breakout base.
The timing of the social and whale activity adds caution. Participation became most intense as SHIB reached major resistance, rather than at the beginning of the move.
- Disclaimer: This article is for informational and analytical purposes only and does not constitute financial or investment advice. Technical levels, social metrics and on-chain activity do not guarantee future price movements.
- Methodology: Price levels are based on the supplied daily SHIB/USD Coinbase chart captured on July 27, 2026. Social dominance and large-transaction figures come from the supplied Santiment analysis. Whale transaction counts measure transfers above $100,000 but do not establish their direction or purpose.



Alex is Editor-in-Chief of Coindoo and co-founder of Millennial Media Group, with nearly a decade of experience covering financial markets - crypto first, then everything else. It started in 2016 with Bitcoin. Like most people at the time, he didn't fully understand it - so he kept digging. Blockchain, tokenomics, the projects, the cycles. That curiosity never stopped, and eventually pulled him into traditional markets too: equities, commodities, macro. Not because he left crypto behind, but because you can't properly understand one without the other. What drives him is straightforward: he wants to know why something is happening, not just that it's happening. Most market coverage stops at the headline - price up, price down, here's a chart. Alex finds that kind of reporting actively unhelpful. If you walk away from an article without understanding the mechanism behind the move, what did you actually learn? He holds a degree in Tourism from New Bulgarian University - not the most obvious path into financial markets, but markets have a way of pulling in people who are simply too curious to stay out. He has authored over 200 in-depth analyses and more than 10,000 articles across crypto and traditional finance. He still thinks every day in markets teaches him something new. That's probably why he hasn't stopped.