On-Chain Flow Update: Binance ETH Outflows and Price Trends
A spike in Ethereum leaving Binance has raised the question of whether smart money is quietly building a floor under ETH at a key support level.
Key Takeaways
- CryptoQuant flagged a notable spike in ETH outflows from Binance in June 2026.
- Outflows can signal coins moving to cold storage or staking, off the sell side.
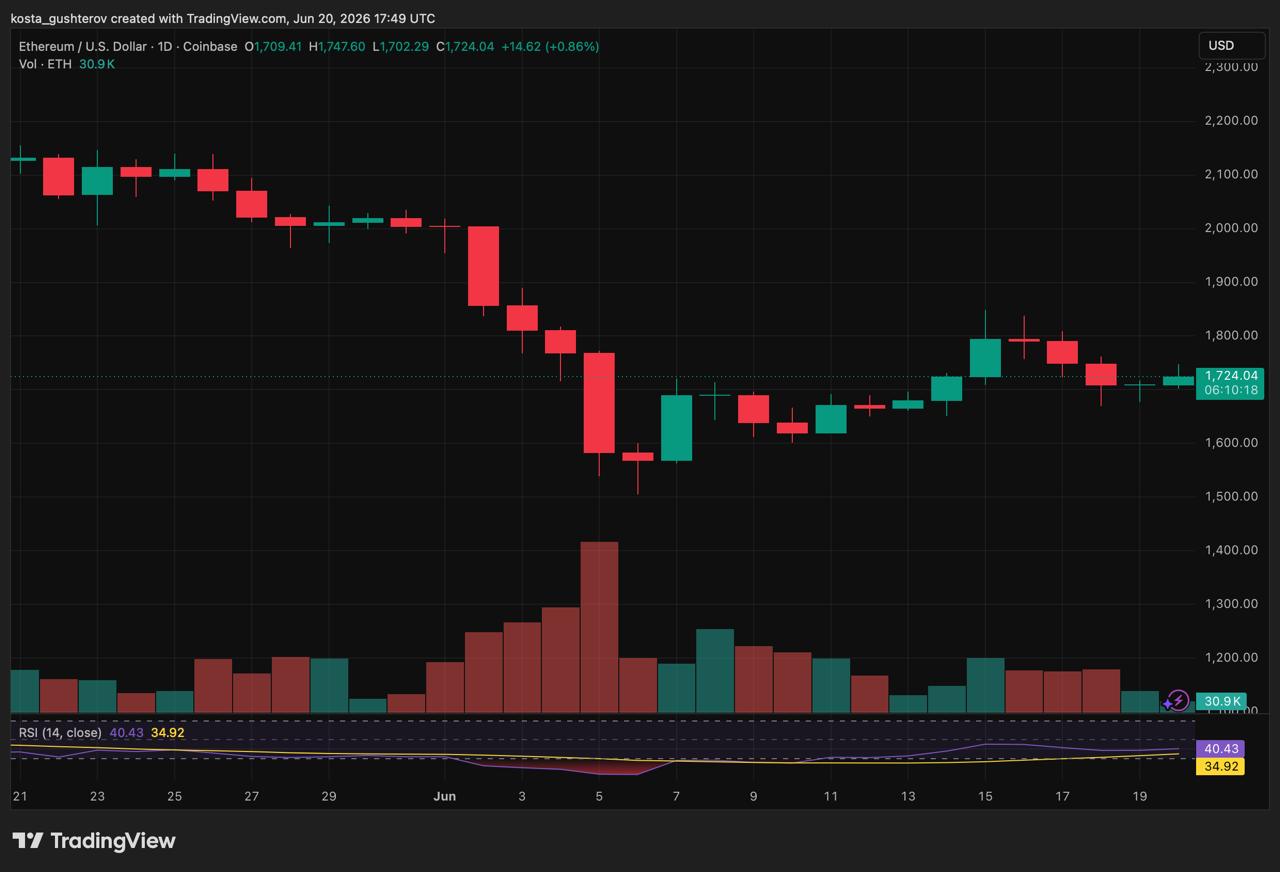
- ETH is testing major support after falling to 13-month lows near $1,500-$1,700.
- Heavy exchange inflows and ETF outflows complicate the bullish read.
- Sustained outflows could fortify support; renewed inflows could negate it.
The signal is real, but it sits inside a market flashing conflicting signs, which makes the read more contested than a simple bull case.
The Signal: A Spike in ETH Leaving Binance
According to a CryptoQuant analysis, the ETH outflow metric on Binance recorded a notable spike in June 2026, with a large amount of Ether withdrawn from the exchange while price hovered near a key support zone. Exchange outflows matter as a sentiment gauge because of what they tend to represent: when coins leave an exchange, they are generally moving into cold storage or staking, away from the immediate sell-side order books. That makes outflows a rough proxy for holders shifting from active trading to passive holding.
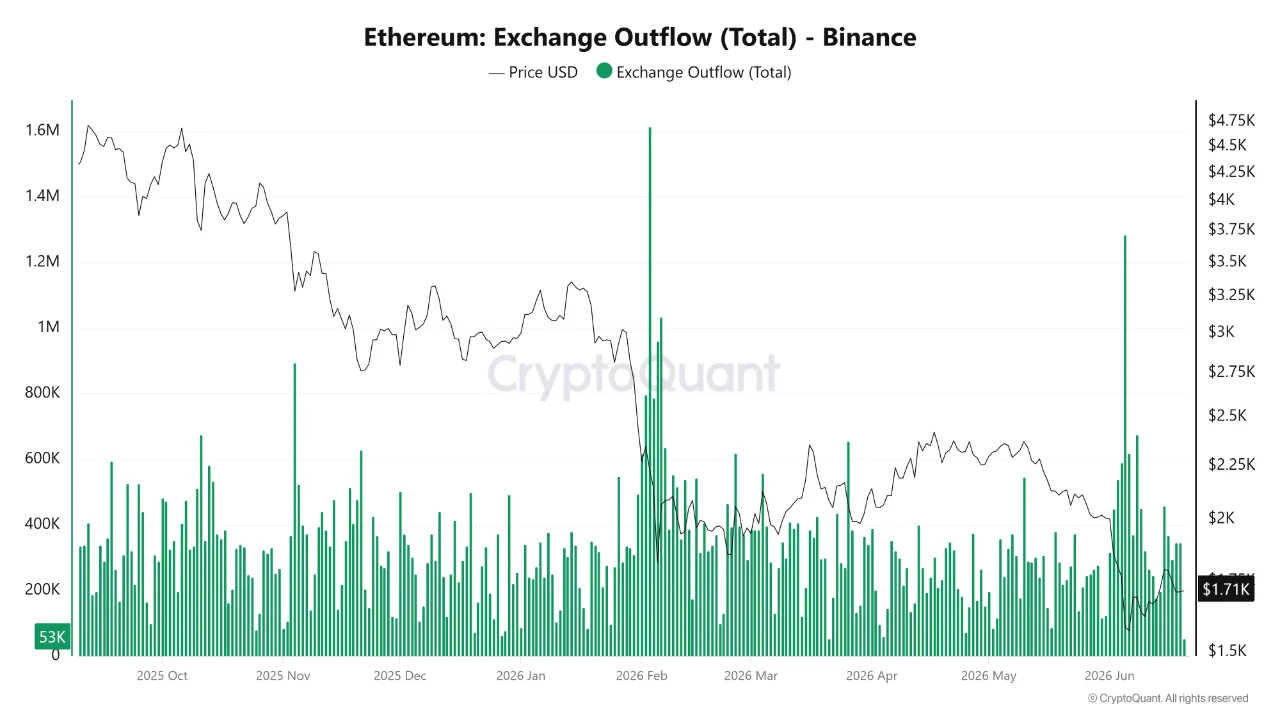
Binance is a meaningful focal point for this read specifically because it is the largest exchange by volume, so its flow data captures behavior at scale rather than the quirk of one venue. A pronounced outflow spike there is harder to dismiss than the same move on a smaller platform.
The Bull Case: A Supply-Side Floor
The constructive interpretation is that this behavior fortifies support. When large amounts of ETH are pulled off exchanges during price stagnation at a low zone, the available float for selling shrinks. If the coins moving off Binance are headed into cold wallets or staking contracts, that capital is effectively removed from the immediate sell side and placed in the hands of conviction-based holders rather than short-term traders.
The logic follows that this lowers the probability of a sharp breakdown, because there is simply less readily sellable supply sitting on the exchange. In this framing, accumulation at support is a quiet vote of confidence, the kind of supply-side tightening that can precede stabilization if it persists.
The Bear Case: The Signals That Cut the Other Way
The broader June data complicates the bullish narrative considerably. The same month saw Ethereum exchange inflows hit a four-month high, with on-chain data showing roughly 2.24 million ETH flowing onto exchanges in a single day on June 6, and Binance absorbing more than half of that. Inflows are the mirror image of the bull case: coins arriving on exchanges are often positioned to sell.

The backdrop is heavier still. US spot Ethereum ETFs ran a streak of more than 17 consecutive sessions of net outflows, draining institutional demand, while ETH printed 13-month lows in the $1,500 to $1,700 range as we can see on the TradingView chart with negative funding and thinning open interest. By mid-June, ETH had broken below a rising channel, with some analysts eyeing $1,580 and then $1,400 as the next downside markers. In other words, the outflow spike is one constructive thread inside a market that was mostly flashing caution.
There is also a technical reason not to read outflows as automatically bullish. Large withdrawals do not always mean long-term holding. They can sometimes precede over-the-counter deals, where tokens are moved off-exchange not to be tucked away, but to be sold privately to avoid the price slippage a large on-exchange sale might cause. An outflow spike can therefore look identical on a dashboard whether the coins are being accumulated for conviction or quietly routed toward a private sale. The metric alone cannot distinguish the two, which is why it should never be read in isolation.
What Could Confirm or Kill the Thesis
The cleanest way to treat this is as a live test rather than a settled signal. The supply-floor thesis strengthens if outflows continue and exchange balances keep falling while price holds its support zone, evidence the float is genuinely tightening. It weakens, or breaks, if exchange inflow volume spikes again in the coming sessions, which can signal coins returning to the sell side and negate the bullish read entirely. A renewed leg down in ETF outflows might point the same bearish direction.
For now, the most accurate description is a market in balance at a critical level: a real outflow signal suggesting some participants are accumulating, set against inflow and ETF data suggesting others are still heading for the exit. Which side wins is what the next stretch of flow data has to reveal.

Alexander Zdravkov is a market analyst and crypto journalist with interests in economics, broader financial markets and digital assets. His journey into crypto began more than four years ago, driven by a fascination with the rapid evolution of blockchain technology and the transformative potential of decentralized finance. He began analyzing market cycles and identifying emerging trends before they reach the mainstream. He holds a degree in International Relations - a background that helped shape his broader perspective on global economics, geopolitics, and the interconnected nature of modern financial markets. Whether covering the latest developments in the crypto sector or exploring broader macroeconomic themes, Alexander focuses on giving readers context rather than simply repeating headlines. During his career, he has authored more than 5,000 articles covering cryptocurrencies, traditional finance, and global market developments. His work spans everything from Bitcoin and altcoins to macroeconomic trends influencing risk assets worldwide.