NEAR Price Holds Its Triple Floor After a Leverage Washout
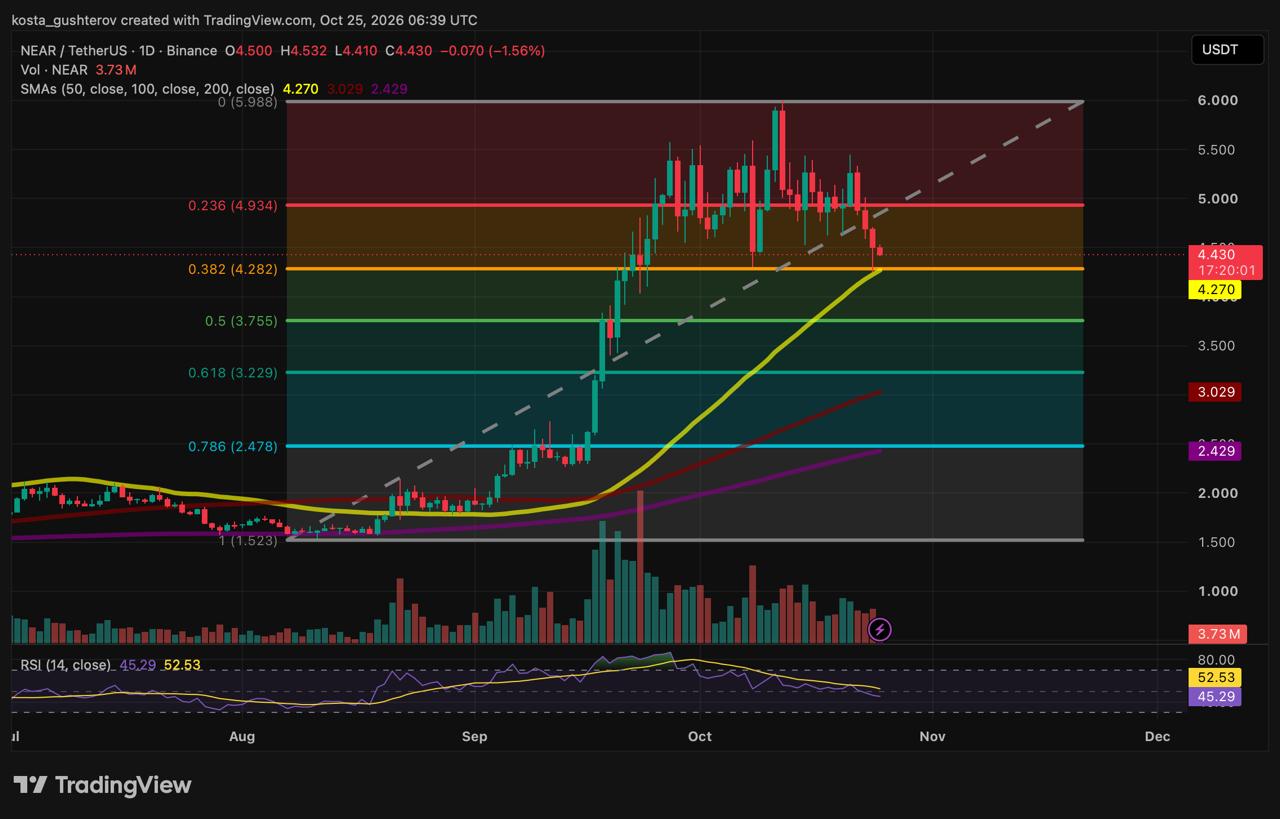
NEAR Protocol (NEAR) is down about 1.6% on Sunday, trading near $4.43 after buyers stopped Saturday’s sell-off at a support zone where three key levels meet.
Three lines, one floor
Saturday’s low landed in a narrow band where three separate levels overlap: the 0.382 Fibonacci retracement of that rally, the rising 50-day SMA, and the October 8 swing low.
| October 8 swing low · ~$4.29 |
| 0.382 Fib · ~$4.28 |
| 50-day SMA, still rising · ~$4.27 |
The long lower wick on Saturday’s candle shows buyers stepping in across that band and pulling price well off the lows by the close.
How Saturday’s flush played out
| Step 1NEAR loses the 0.236 Fib near $4.93 | → | Step 2$11.65M in longs liquidated in one hour | → | Step 3Open interest shrinks about 9.5% |
The liquidations hit in the hour to 14:20 UTC on Saturday, as NEAR fell to about $4.34, according to CoinGlass data. Over the following day, open interest in NEAR futures dropped about 9.5%, Coinalyze data shows.
That sequence makes this pullback look more like a washout than a breakdown. Falling open interest means positions were being closed rather than new bets against NEAR being opened, so much of Saturday’s selling came from forced exits. And it happened right on the strongest support on the chart.
What the dip buyers are leaning on
Buyers at the floor also have a fundamental story. NEAR’s third-quarter update put cumulative volume on NEAR Intents, its cross-chain swap system, above $32 billion, with more than $52 million in fees and over $8 million directed to NEAR buybacks. That gives the token a source of demand tied directly to network revenue.
The system also had a setback this month. A $3.8 million exploit in early October forced NEAR Intents to pause, and the team has said affected users were made whole.
Above and below the floor
|
Overhead ~$5.99 · October 10 peak (+35%) ~$5.43 · October 21 rebound high (+23%) ~$4.93 · 0.236 Fib, lost Saturday (+11%) |
Below the floor ~$3.76 · 0.5 Fib (−15%) ~$3.03-$3.23 · golden pocket and 100-day SMA (−27% to −32%) ~$2.43-$2.48 · 0.786 Fib and 200-day SMA (−44% to −45%) |
The upper column shows the problem for bulls. Each rebound since the peak has topped out lower, and the 0.236 Fib flipped from support to resistance on Saturday. Below the floor, the gap to the next level is wide, about 15% to the 0.5 Fib.
Floors built from a Fibonacci level and a rising average have become the key battleground across large altcoins this month, much like HYPE’s pullback toward support near $74.5.
Momentum and the bear case
RSI sits near 45, below its signal line near 53 and just under the 50 midpoint. The pullback has cooled momentum from overbought readings near the October peak without pushing it toward oversold territory.
The bear case is that rallies keep fading at lower levels while the floor stays fixed, which leaves buyers less room each time they have to defend it.
Two Paths From the $4.27 Floor
NEAR sits about 3% above the $4.27–$4.28 floor, with the 0.236 Fib near $4.93 overhead.
If buyers keep holding the floor
Daily closes above $4.27 keep the structure intact, and a bounce could carry NEAR back toward the 0.236 Fib.
If the floor breaks
A daily close below $4.27 before the end of October could open a deeper pullback toward the 0.5 Fib.
Bigger picture
The 100- and 200-day SMAs sit far below price and remain stacked in bullish order, so even a move to the 0.5 Fib would leave NEAR’s longer-term uptrend in place.
This article is provided for informational purposes only and does not constitute financial advice. Cryptocurrency prices are volatile.



Alexander Zdravkov is a market analyst and crypto journalist with interests in economics, broader financial markets and digital assets. His journey into crypto began more than four years ago, driven by a fascination with the rapid evolution of blockchain technology and the transformative potential of decentralized finance. He began analyzing market cycles and identifying emerging trends before they reach the mainstream. He holds a degree in International Relations - a background that helped shape his broader perspective on global economics, geopolitics, and the interconnected nature of modern financial markets. Whether covering the latest developments in the crypto sector or exploring broader macroeconomic themes, Alexander focuses on giving readers context rather than simply repeating headlines. During his career, he has authored more than 5,000 articles covering cryptocurrencies, traditional finance, and global market developments. His work spans everything from Bitcoin and altcoins to macroeconomic trends influencing risk assets worldwide.