Bitcoin vs Gold Signals a Turning Point as RSI Falls to Historic Extreme

Bitcoin’s performance against gold has reached a level that has historically appeared only at major turning points in the market cycle.
According to analysis shared by Michaël van de Poppe, the Bitcoin-to-gold ratio has pushed its Relative Strength Index (RSI) below 30, a signal typically associated with deeply oversold conditions.
- Bitcoin’s RSI against gold has dropped below 30, a level previously seen only at major cycle lows.
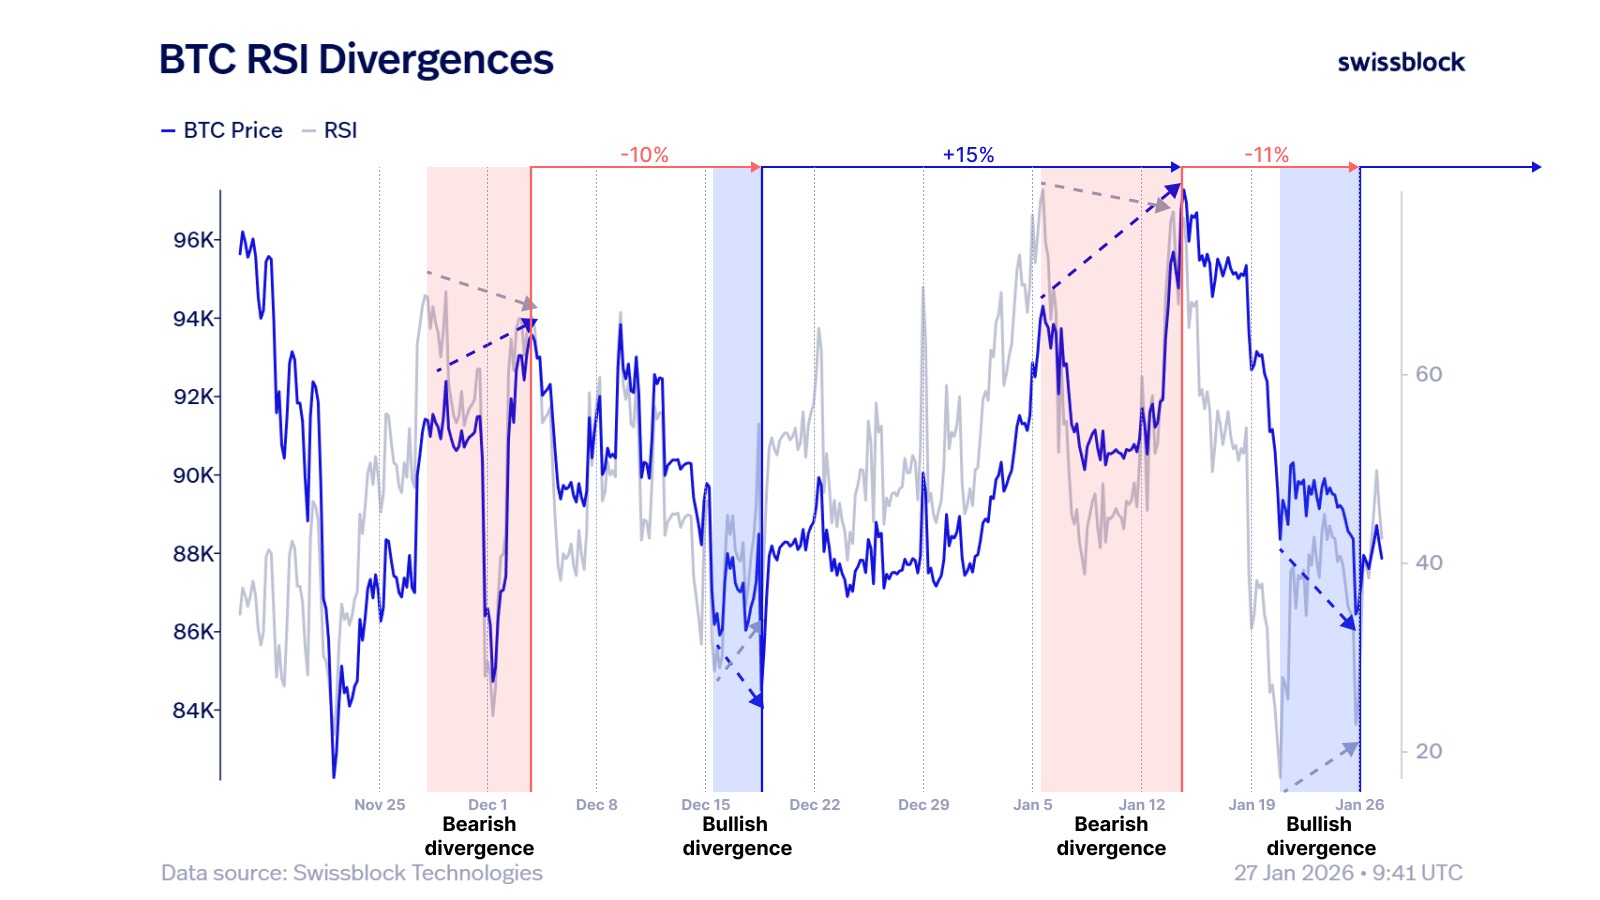
- A bullish divergence between Bitcoin price and RSI suggests momentum may be turning higher.
- Past setups of this kind have often preceded double-digit rebounds rather than further declines.
- Confirmation depends on improving liquidity and network fundamentals alongside technical recovery.
This setup has occurred just three times in Bitcoin’s history – during the bear market lows of 2015, 2018, and 2022. Each instance marked the end of prolonged downside pressure and the beginning of a new expansion phase rather than the continuation of a broader decline.
Bitcoin-to-Gold RSI Signals Capitulation Phase
The RSI measure compares momentum rather than price alone, making it useful for identifying exhaustion points in longer-term trends. A sub-30 RSI in the BTC/gold pair suggests Bitcoin has significantly underperformed gold over recent months, often reflecting heightened risk aversion and capital rotation toward traditional safe havens.
Historically, this type of divergence has coincided with periods when downside risk was already largely priced in. Rather than signaling further weakness, it has tended to precede renewed strength in Bitcoin as market conditions stabilize and risk appetite gradually returns.
Bullish RSI Divergence Emerges on Bitcoin Price
At the same time, shorter-term technicals are beginning to show early signs of recovery. A bullish divergence is forming between Bitcoin’s price and its RSI, with momentum improving even as price action remains relatively muted. Similar setups in recent months have been followed by rebounds of roughly 10% on comparable timeframes.
If that historical pattern holds, a move back toward the $95,000 area would be consistent with prior reactions to comparable RSI divergences. Analysts caution, however, that confirmation will depend on broader market alignment rather than technical signals alone.

Liquidity and Network Strength Seen as Key Confirmation
Beyond chart patterns, the broader signal lies in confluence. Sustained improvement in network fundamentals, combined with stabilizing or improving liquidity conditions, would strengthen the case for a more durable upside move. Holding Bitcoin dominance during such a phase would further support the idea that capital is rotating back into BTC rather than dispersing across riskier assets.
Taken together, the combination of extreme relative weakness versus gold and improving internal momentum is increasingly being interpreted as a transition phase. Instead of the start of a new bear market, current conditions resemble the early stages that have historically preceded major bullish reversals.
The information provided in this article is for educational purposes only and does not constitute financial, investment, or trading advice. Coindoo.com does not endorse or recommend any specific investment strategy or cryptocurrency. Always conduct your own research and consult with a licensed financial advisor before making any investment decisions.


Alex is an experienced financial journalist and cryptocurrency enthusiast. With over 8 years of experience covering the crypto, blockchain, and fintech industries, he is well-versed in the complex and ever-evolving world of digital assets. His insightful and thought-provoking articles provide readers with a clear picture of the latest developments and trends in the market. His approach allows him to break down complex ideas into accessible and in-depth content. Follow his publications to stay up to date with the most important trends and topics.