Bitcoin Holds Near $70K as Market Enters Accumulation Phase
Bitcoin is trading near the $70,700 level as the broader cryptocurrency market consolidates following recent volatility.
Key Takeaways
- Bitcoin is trading around $70,700, consolidating after recent volatility.
- The total crypto market capitalization stands near $2.41 trillion, reflecting a modest decline.
- RSI indicators show neutral momentum, suggesting the market is neither overbought nor oversold.
- MACD signals indicate weakening bearish momentum, hinting at potential stabilization.
Despite a slight pullback in the overall crypto market capitalization – now sitting around $2.41 trillion, down roughly 1.36% – Bitcoin continues to show relative resilience. BTC Exchange traded funds attracted more than $750 millions in the past five days.
Short-term price action indicates a market caught between consolidation and cautious accumulation, with technical indicators suggesting that traders are preparing for the next major move.
The latest price charts reveal a market that has been oscillating between key support and resistance levels while momentum indicators gradually stabilize.
On-chain data such as the MVRV ratio near 1.2 suggests the market is entering an accumulation phase rather than a full capitulation.
Short-Term Price Action Remains Range-Bound
The intraday charts show Bitcoin trading in a relatively tight range between $70,400 and $70,900, indicating a lack of strong directional conviction among traders.
During the latest trading sessions, Bitcoin briefly attempted to push toward the $71,000 resistance level, but sellers quickly emerged, forcing the price back toward the mid-$70K range. This pattern suggests that the market is currently in a consolidation phase where buyers and sellers are evenly matched.
READ MORE:
Solana Hits $650 Billion in Monthly Stablecoin Transactions as Grayscale Outlines 2026 Outlook
The one-minute and five-minute charts highlight frequent short-term swings, with the price repeatedly bouncing between micro-support and resistance zones. Such behavior typically reflects algorithmic trading and liquidity-driven movements, rather than a clear macro trend.
For now, the $70,000 level remains the most important psychological support. As long as Bitcoin maintains this level, bullish sentiment is likely to remain intact.
Momentum Indicators Suggest Neutral Conditions
Technical indicators reinforce the view that the market is currently neutral.
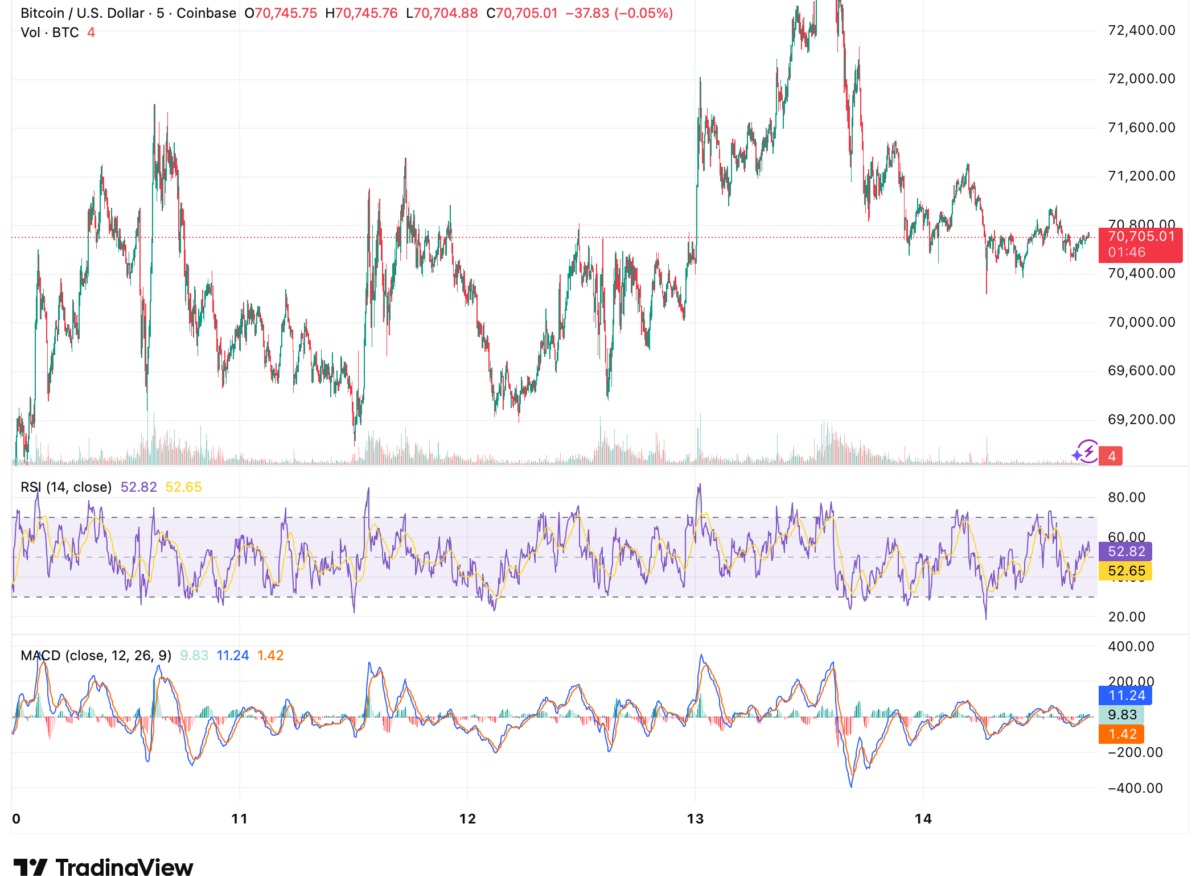
The Relative Strength Index (RSI) on short timeframes sits between 52 and 61, indicating moderate buying pressure but not an overbought condition. In general, RSI readings around the mid-50 range suggest that the market is balanced, with neither bulls nor bears holding a clear advantage.
The Moving Average Convergence Divergence (MACD) indicator also provides insight into market momentum. The MACD line is slightly above the signal line, while the histogram remains near the neutral zone. This configuration typically indicates that bearish momentum is fading, though a strong bullish trend has not yet emerged.
Taken together, these signals suggest that Bitcoin may continue trading sideways in the near term before a stronger directional move develops.
On-Chain Data Signals Accumulation Phase
Beyond short-term technical indicators, on-chain data provides important clues about the broader market cycle.
One of the most closely watched metrics, the Market Value to Realized Value (MVRV) ratio, currently sits around 1.2. Historically, this level has often been associated with accumulation phases, where long-term investors gradually increase exposure after periods of market stress.
🚨BITCOIN BOTTOM NOT IN YET
Despite BTC’s resilience during the war, on-chain data suggests the market is still in a “stress test” phase.
An analyst notes MVRV sits around 1.2, an accumulation zone. True cycle bottoms typically occur below 1.0, during full capitulation. pic.twitter.com/g9A4zxzLEg
— Coin Bureau (@coinbureau) March 14, 2026
True cycle bottoms typically occur when the MVRV ratio falls below 1.0, which indicates that the average Bitcoin holder is underwater relative to their purchase price. Such conditions often correspond with full market capitulation.
Because the current reading remains above that threshold, analysts suggest that the market may still be in a mid-cycle consolidation rather than a final bottoming phase.
However, the fact that the ratio is approaching historically attractive accumulation levels suggests that long-term investors may already be gradually building positions.
Market Sentiment Remains Cautiously Optimistic
Despite ongoing macro uncertainty and geopolitical tensions, Bitcoin has demonstrated notable resilience. The asset has maintained its position above key psychological levels even during periods of broader market stress.
This resilience is partly supported by structural changes in the market. Institutional participation has increased significantly over the past few years, particularly through spot Bitcoin exchange-traded funds (ETFs), which have introduced a steady source of demand.

At the same time, Bitcoin continues to benefit from its reputation as a store-of-value asset within the digital economy, especially during periods of financial uncertainty.
Nevertheless, sentiment across the crypto market remains cautious. The recent decline in total market capitalization indicates that traders are still managing risk carefully.
Key Levels to Watch
From a technical perspective, several levels will likely determine Bitcoin’s next major move.
Immediate support:
- $70,000
- $69,500
Short-term resistance:
- $71,000
- $72,400
A sustained breakout above the $71,000 – $72,000 resistance zone could trigger renewed bullish momentum and potentially open the door for a retest of recent highs.
Conversely, a breakdown below $70,000 could accelerate short-term selling pressure and push Bitcoin toward deeper support levels near $69,000 or $68,500.
Outlook: Consolidation Before the Next Trend
For now, Bitcoin appears to be entering a consolidation phase following recent volatility, with price action stabilizing near the $70K region.
Technical indicators, on-chain metrics, and macro sentiment all point to a market that is neither strongly bullish nor bearish. Instead, traders appear to be waiting for new catalysts that could determine the next major trend.
Possible triggers include:
- Continued institutional inflows into Bitcoin ETFs
- Changes in global monetary policy
- Regulatory developments affecting the crypto industry
- Macro-economic shifts influencing risk assets
If Bitcoin can maintain support above key psychological levels while accumulation continues on-chain, the current consolidation period may ultimately serve as the foundation for the next leg higher in the broader crypto market cycle.
The information provided in this article is for educational purposes only and does not constitute financial, investment, or trading advice. Coindoo.com does not endorse or recommend any specific investment strategy or cryptocurrency. Always conduct your own research and consult with a licensed financial advisor before making any investment decisions.


Alexander Zdravkov is a market analyst and crypto journalist with interests in economics, broader financial markets and digital assets. His journey into crypto began more than four years ago, driven by a fascination with the rapid evolution of blockchain technology and the transformative potential of decentralized finance. He began analyzing market cycles and identifying emerging trends before they reach the mainstream. He holds a degree in International Relations - a background that helped shape his broader perspective on global economics, geopolitics, and the interconnected nature of modern financial markets. Whether covering the latest developments in the crypto sector or exploring broader macroeconomic themes, Alexander focuses on giving readers context rather than simply repeating headlines. During his career, he has authored more than 10,000 articles covering cryptocurrencies, traditional finance, and global market developments. His work spans everything from Bitcoin and altcoins to macroeconomic trends influencing risk assets worldwide.