Hyperliquid Price Falls 8.5% – What the Fibonacci Structure Says

HYPE is cooling after hitting $64.72 ATH, RSI pulled back from 78 to 62 while the trend stays bullish and Fibonacci levels mark where bulls could step back in.
Key Takeaways:
There are visible signs of cooling and exhaustion from the bulls after this bullish run for HYPE. RSI on the daily chart from TradingView reached overbought levels at the top, climbing to 78. Now we can also see cooling there, with RSI currently at 62. However, it still remains above 50, which means the trend is still bullish and HYPE has entered a healthy correction phase. The overall trend remains bullish, but in the short term we are seeing cooling.
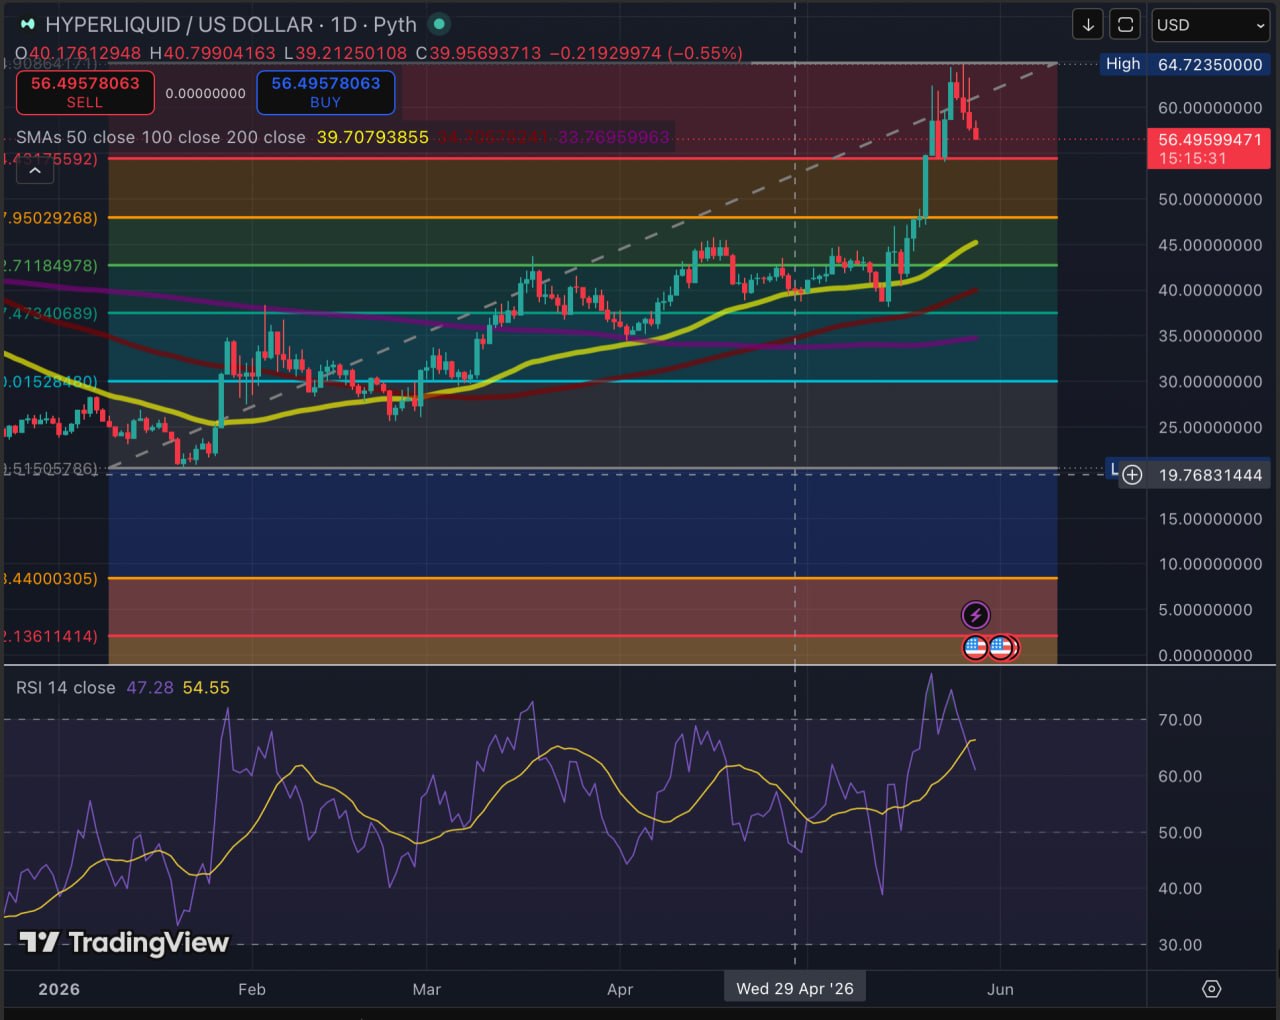
Another thing supporting the short-term cooling thesis is that at the top, price made higher highs while RSI made lower highs, a divergence that was visible before the correction began.
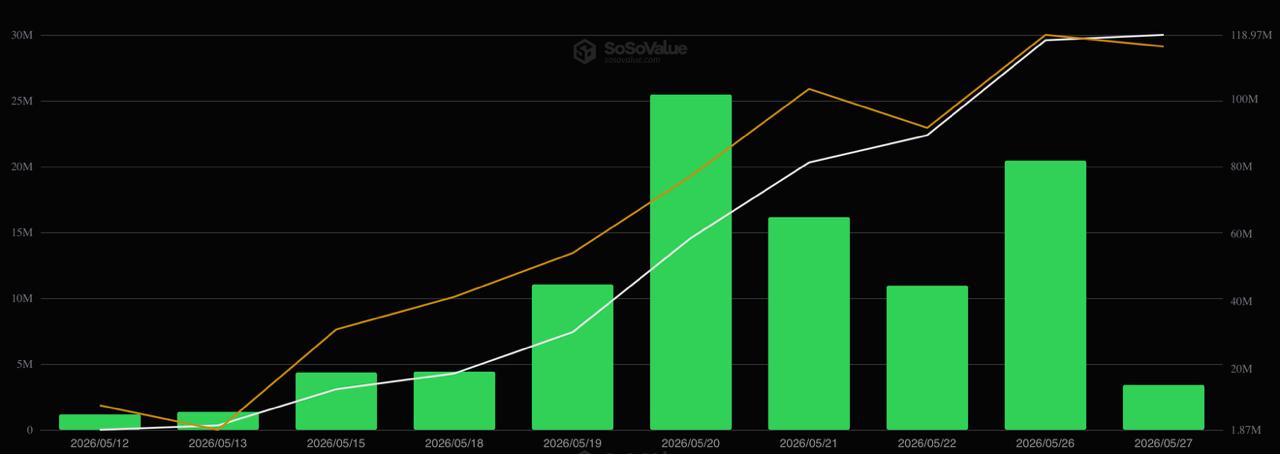
Something that makes HYPE’s correction stand out from the broader market selloff is what’s happening in its ETF flows. While Bitcoin and Ethereum spot ETFs have been recording consecutive days of outflows, HYPE spot ETFs have seen inflows every single day since May 12 according to SoSoValue data.
Total net assets reached $118.97M with cumulative inflows building steadily throughout the month, $1.17M on May 12, accelerating to $25.46M on May 20, and still positive at $3.40M on May 27 even as price was pulling back. That consistent institutional demand running alongside a price correction is a different signal than what most of the market is producing right now.
Three scenarios based on Fibonacci
It is important to watch Fibonacci levels right now because price is trading far above the SMAs, which means the move has become very extended. When price runs this far ahead of its moving averages, the SMAs lose some of their short-term relevance as immediate support references, they are simply too far below current price to act as a floor in the near term. As a result, many traders will likely pay closer attention to Fibonacci levels as they search for support zones and potential entry areas.
The first support based on Fibonacci levels is the 0.236. If price manages to hold above this level and confirms with a green candle, it would mean the bulls are taking back control, remaining optimistic and aggressive, and it becomes very likely that we see continuation to the upside.

If it fails to hold, then we move toward the next 0.382 level along with a possible RSI drop below 60, which could indicate a healthier correction. This is also a strong support zone since the 50 SMA is sitting around those levels. Between $48 and $45 there could be very strong support. Even if price drops there it still might not necessarily mean a bearish trend reversal, on the contrary, it could become a good area for bulls to regain control and start accumulating again.
If price falls below the 0.5 Fibonacci level, the 100 SMA becomes the next important level where a strong bullish reaction could also appear along with a possible reversal back to the upside.
The most bullish scenario would be if price pulls back slightly but manages to stay above the 0.236 Fib level with only a weak correction. Another bullish case would be a drop toward the next Fib level where the 50 SMA also comes into play, creating what could be a very healthy correction. Either way the overall trend for HYPE remains bullish, the short-term cooling is a natural part of the move, not a reversal of it.
The information provided in this article is for educational purposes only and does not constitute financial, investment, or trading advice. Coindoo.com does not endorse or recommend any specific investment strategy or cryptocurrency. Always conduct your own research and consult with a licensed financial advisor before making any investment decisions.



Kosta has reported on cryptocurrency markets and blockchain infrastructure since 2020, bringing over six years of hands-on experience in the crypto industry built through daily tracking of markets, trends, and emerging blockchain developments. Specializing in Bitcoin on-chain analysis, institutional ETF flows, and digital asset price action, his work at Coindoo has been cited by other news agencies and consistently covers market developments with a focus on data-driven reporting across Bitcoin, Ethereum, Solana, and XRP. Over the years, Kosta has contributed to multiple crypto media outlets in different regions, authoring over 6,000 articles across the sector. His reporting spans cryptocurrency markets and the broader fintech industry, tracking not only price action but also the technological and regulatory forces shaping the ecosystem. To support his analysis, Kosta actively leverages on-chain data and metrics from leading platforms such as Santiment, Glassnode, and CryptoQuant, enabling deeper, evidence-based market insights. He believes in the power of transparency and the data that underpins the blockchain ecosystem. His academic background in Marketing Management from Denmark further complements his analytical approach, adding a strong understanding of communication strategy and content positioning to his work.