HYPE Price Rebounds, but Hyperliquid Q2 Raises Questions

Hyperliquid processed more volume and attracted more traders in Q2, but lower-fee markets took a larger share of activity, leaving protocol and holder revenue below the previous quarter.
Key Takeaways
- HYPE now faces stacked resistance near $57-$58.
- HIP-3 captured 32.2% of matched quarterly volume.
- June delivered Hyperliquid’s strongest revenue since November.
- Assistance Fund holdings reached 45.56 million HYPE.
- Team claimed only 4.3% of quarterly entitlement.
- Outcome markets generated volume but almost no fees.
HYPE Tests a Stacked Resistance Zone
When the chart was captured on August 5, HYPE traded near $57, up approximately 3.9% during the session. The rebound brought the price into two technical barriers at once: the 0.5 Fibonacci retracement and the 100-day simple moving average near $58.
The overlap makes the $57–$58 area a decision point rather than a confirmed breakout. Both levels previously acted as barriers, increasing the risk that buyers lose momentum before establishing support above them.
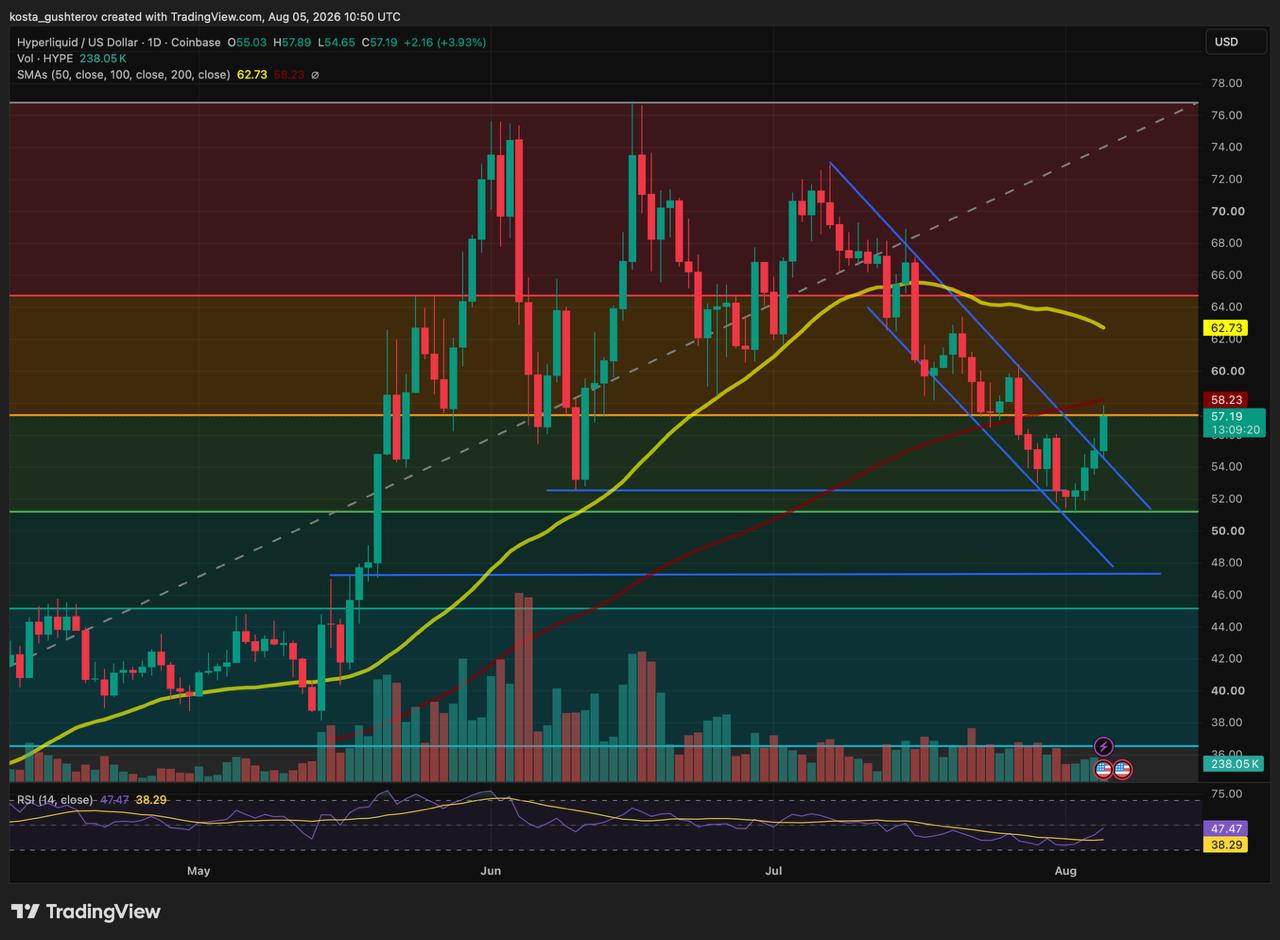
A daily close above the zone followed by a successful retest would improve the structure. The next major resistance sits around $62–$63, where the 50-day SMA was positioned near $62.5. Above that, the broader resistance area near $65 would return to focus.
Until the breakout is confirmed, a rejection remains possible. The first important support sits around $52, where buyers stopped the latest decline. Losing that area would expose the lower support near $47.
The daily RSI had recovered to approximately 47.5, showing improved momentum during the rebound but no decisive move into bullish territory above 50.
The technical setup now sits against a mixed fundamental backdrop. Hyperliquid entered Q3 with stronger trading activity, but lower quarterly revenue and a growing reliance on lower-fee markets.
The Hyperliquid 2Q2026 Quarterly Report is not a conventional company-issued financial statement. HRC, GLC Research and Four Pillars reconstructed the figures from public ledger records, independent data providers and protocol disclosures.
The report shows a clear gap between activity and monetisation. Protocol revenue declined 6.6% to $169.37 million and the report’s holder revenue measure fell 4.7% to $142.88 million, even as overall protocol TVL increased 16.8% to $5.72 billion.
More Trading Activity Produced Less Revenue
Traders paid $197.67 million in gross fees during Q2, down 5.9% from $210.04 million in the previous quarter. Of that total, approximately $28.31 million accrued to builders, deployers and other ecosystem participants rather than becoming protocol revenue.
Several operating indicators still moved higher:
- Matched volume rose 2.7% to $662.4 billion.
- Average open interest increased 25.4% to $8.68 billion.
- Quarter-end open interest climbed 28.6% to $9.31 billion.
- Average daily perpetual traders increased 19.8% to 54,294.
- Spot volume improved 5.3% to $16.2 billion.
Revenue fell because more activity shifted from Hyperliquid’s higher-fee native perpetual markets into lower-priced builder-deployed markets.
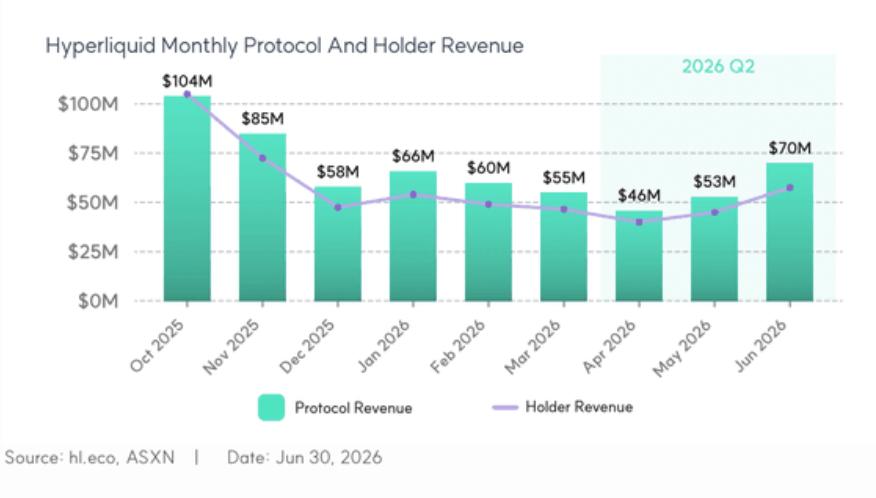
The quarter also ended more strongly than it began. Protocol revenue fell to $46.19 million in April, recovered to $53.14 million in May and reached $70.03 million in June, its strongest monthly result since November 2025.
HIP-3 Became Hyperliquid’s Main Growth Engine
Native perpetual volume declined for a third consecutive quarter, falling 12.7% to $432.9 billion. Growth instead came from HIP-3 builder-deployed perpetual markets.
HIP-3 volume increased 59.6% to $213.3 billion and represented 32.2% of all matched volume, up from 20.7% in Q1. HIP-3 open interest ended the quarter at $3.09 billion, a further 47.2% increase.
Under HIP-3, independent builders can deploy perpetual markets on Hyperliquid’s infrastructure rather than waiting for the protocol’s main listing process. Deployers choose important market parameters, provide their own front ends and can receive a share of the fees generated by their markets.
This expands the range of markets available on Hyperliquid, but HIP-3 volume generates less protocol revenue than activity on the native perpetual venue. Hyperliquid’s Growth Mode fee structure reduces protocol fees, rebates, volume contributions and certain rate-limit contributions by 90% for eligible markets, helping them attract traders without immediately replacing the revenue lost from declining native activity.
One Deployer Captured Almost All HIP-3 Volume
The listing layer also became more concentrated. Trade[XYZ] accounted for approximately 81% of HIP-3 volume in February and 93% in April. By July, after the quarter ended, its share had approached 100% as other deployers wound down or migrated their markets.
Shared liquidity means that fewer deployers do not necessarily translate into less underlying market liquidity, as multiple interfaces can route users into the same order book. The concentration still matters at the deployment layer: Trade[XYZ] may benefit from stronger liquidity and easier market discovery, but users now have fewer meaningful alternatives.

Buybacks Continued, but the HYPE Price Changed the Math
The Assistance Fund purchased 2.77 million HYPE for $140.66 million during Q2, giving the quarter an average execution price of approximately $50.80.
The dollar amount was only moderately below the $147.72 million deployed in Q1, but the number of tokens purchased fell 43.9% from 4.94 million HYPE because the token traded at substantially higher prices. The fund remained a source of market demand, although each dollar acquired fewer tokens.
Assistance Fund holdings ended the quarter at 45.56 million HYPE, an increase of 6.4% from Q1 and 78.6% from the same period a year earlier. The report found no discretionary sales during the quarter.
Low Team Claims Reduced Immediate Supply Pressure
Approximately 29.8 million HYPE became available to the team under its scheduled Q2 entitlement, but only 1.289 million tokens were claimed. That represents a 4.3% claim rate, down from 5.1% in Q1 and the third consecutive quarterly decline.
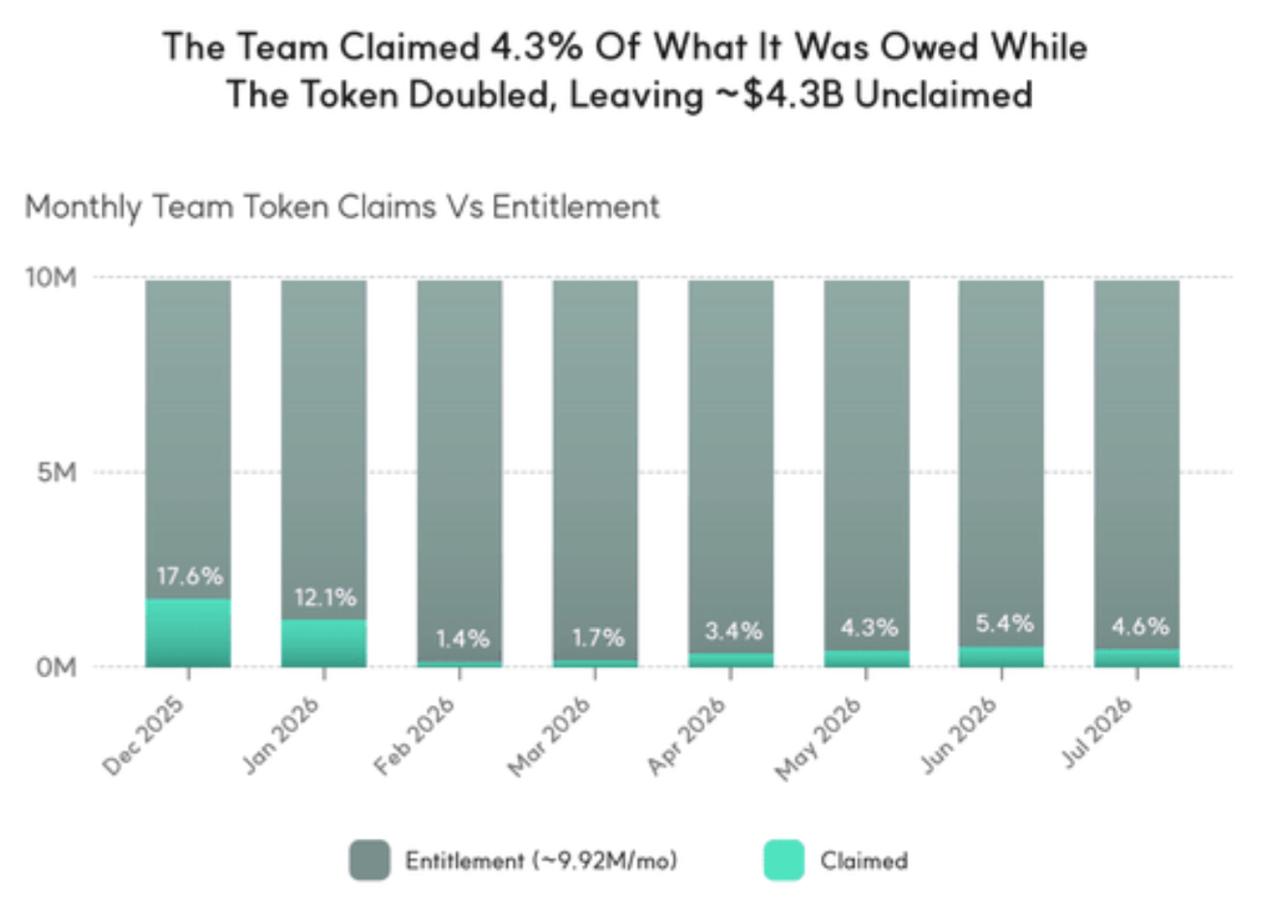
At the report’s calculated average prices, the team claimed around $69 million from an entitlement valued at approximately $1.53 billion. Another 64.9 million vested but unclaimed tokens remained outstanding, worth roughly $4.3 billion at HYPE’s quarter-end price.
The low claim rate limited the quantity becoming immediately available for transfer or sale, but the tokens have not disappeared from supply. They remain claimable, and the monthly entitlement of approximately 9.92 million HYPE continues. A change in team behaviour could alter supply expectations quickly.
New Products Expanded Reach but Added Little Revenue
HIP-4 Volume Was Concentrated Around the World Cup
HIP-4 outcome markets generated $211.3 million of single-sided volume across 59 trading days and attracted 13,046 new traders during the quarter.
Volume doubled from $70.6 million in May to $140.7 million in June, with the strongest day reaching $12.1 million on June 27. Average daily traders also increased from 1,343 in May to 1,506 in June.
Most of that growth came from one event. World Cup markets accounted for 83.8% of tracked market-group volume, while recurring bitcoin markets declined from millions of dollars during their launch week to roughly $100,000 per day by mid-July.
Total HIP-4 fees remained below $3,000 for the quarter. The product attracted traders around major events, but demand across ordinary market cycles remains unproven.
The USDC Migration Opens a New Revenue Question
Hyperliquid also completed its transition away from USDH toward USDC as the main quote asset. The process took approximately 11 weeks from announcement to substantial completion and involved more than $90 million of USDH supply.
According to the report, the migration was completed without a depeg, a stuck bridge or a public dispute. The Hyper Foundation allocated approximately $10 million in grants to affected deployers and HyperEVM applications, with support based partly on auction costs and affected TVL.
Consolidating markets around USDC reduces liquidity fragmentation and could create a new source of reserve-based income through Aligned Quote Asset version 2, or AQAv2. The report estimates potential annual revenue of $135 million to $200 million, but treats that range as unconfirmed.
The estimate depends on the eligible reserve base, interest rates, Coinbase and Circle arrangements and the final share allocated to Hyperliquid. The first reserve-yield payment expected on October 3 would provide the first direct evidence of whether the projected economics are realistic.
HyperEVM Stablecoin Growth Outpaced DeFi Activity
Stablecoins held on HyperEVM increased 313% during the quarter, rising from $1.35 billion to $5.58 billion. HyperEVM TVL moved in the opposite direction, falling 14.8% to $1.44 billion.
The two figures are not directly contradictory: stablecoin balances measure assets held on the network, while TVL tracks capital deployed across applications. Their divergence shows that bringing more dollar-denominated assets onto HyperEVM did not produce equal growth in lending, liquidity pools and other protocols.
Lending-category TVL ended the quarter at $744 million, down 11.7% from Q1 and 38% below its Q3 2025 peak. HyperLend became the largest venue with $407 million in TVL and $252 million in active loans, overtaking Morpho after Morpho’s deposits fell to approximately $248 million.
Four Tests for Hyperliquid’s Next Quarter
- Native perpetual volume: Whether activity stabilises before the platform becomes more dependent on lower-fee HIP-3 markets.
- AQAv2 revenue: Whether the first reserve-yield payment supports the report’s projected economics.
- HIP-4 retention: Whether outcome-market activity continues outside major global events.
- Team claims: Whether the low claim rate continues as more vested HYPE becomes available.
- Methodology: This article is based primarily on the Hyperliquid 2Q2026 Quarterly Report prepared by HRC, GLC Research and Four Pillars. The report reconstructs Hyperliquid’s activity, revenue, token and ecosystem figures using public ledger records, independent data providers and protocol disclosures rather than company-issued financial statements. The HYPE price analysis uses the daily chart captured on August 5, 2026, including price action, Fibonacci retracement levels, simple moving averages, support and resistance zones, and the Relative Strength Index.
- Disclaimer: This article is provided for informational and educational purposes only and does not constitute financial, investment, legal, tax or trading advice. HYPE and other crypto assets are volatile and may lose some or all of their value. Technical levels are not guarantees, and market conditions may change after publication. Readers should verify the underlying data, conduct their own research and assess whether any investment or trading decision is appropriate for their circumstances.



Kosta has reported on cryptocurrency markets and blockchain infrastructure since 2020, bringing over six years of hands-on experience in the crypto industry built through daily tracking of markets, trends, and emerging blockchain developments. Specializing in Bitcoin on-chain analysis, institutional ETF flows, and digital asset price action, his work at Coindoo has been cited by other news agencies and consistently covers market developments with a focus on data-driven reporting across Bitcoin, Ethereum, Solana, and XRP. Over the years, Kosta has contributed to multiple crypto media outlets in different regions, authoring over 6,000 articles across the sector. His reporting spans cryptocurrency markets and the broader fintech industry, tracking not only price action but also the technological and regulatory forces shaping the ecosystem. To support his analysis, Kosta actively leverages on-chain data and metrics from leading platforms such as Santiment, Glassnode, and CryptoQuant, enabling deeper, evidence-based market insights. He believes in the power of transparency and the data that underpins the blockchain ecosystem. His academic background in Marketing Management from Denmark further complements his analytical approach, adding a strong understanding of communication strategy and content positioning to his work.