HYPE Broke Its Record – Can Buyers Defend It?

HYPE has eased from its $83.6 record, but buyers are still defending the breakout area as Hyperliquid posts one of its strongest fee days to date.
Key Takeaways
- HYPE must defend its old high after breaking it.
- $76 is the first line below price.
- A break opens the $71-$72 support area.
- Hyperliquid collected about $6.2 million in daily fees.
- Derivatives volume leaves the move exposed to leverage.
The breakout now has to hold
HYPE pushed to a new all-time high near $83.6 on August 23, before sellers pulled it back. The chart now comes down to one question: can the market keep the old peak beneath price?
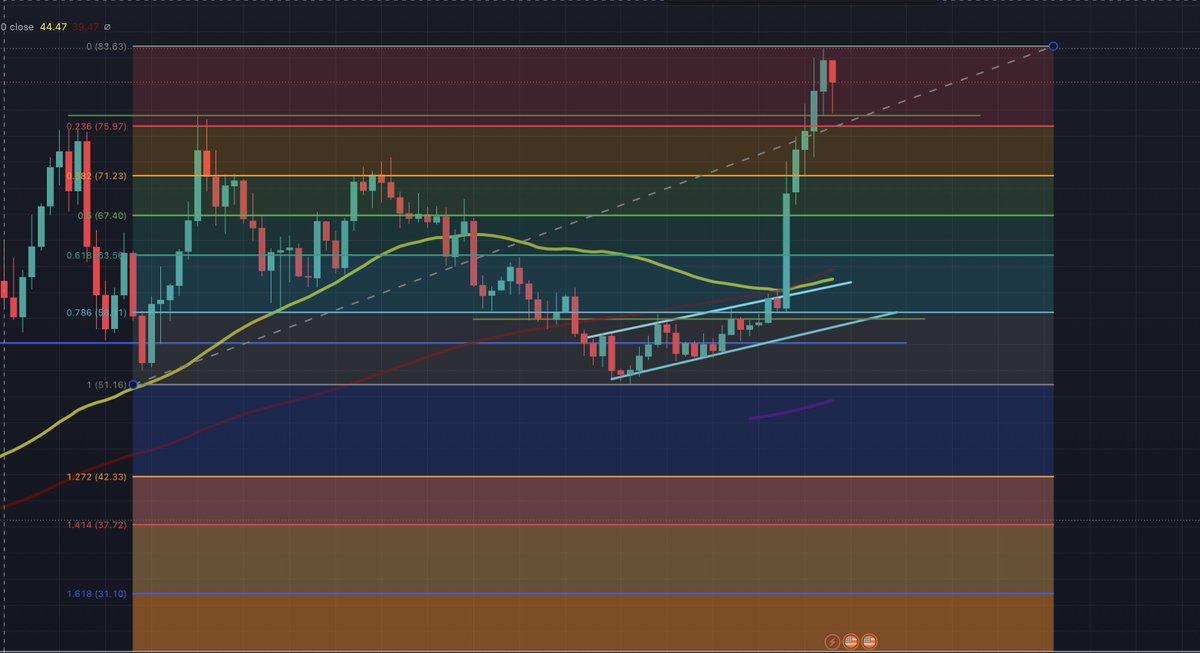
That level was a ceiling on the way up. If it holds as a floor, the pullback looks like ordinary profit-taking after a sharp advance. If price slips back below it and stays there, the breakout loses much of its force.
The first clear level below the current range sits at $76, the 0.236 Fibonacci retracement. That is the nearest point where buyers could show that demand remains intact. Below it, attention shifts to $71–$72. The 0.382 retracement lies near $71.2, close to an earlier horizontal support area, giving that range more weight than a single technical indicator would have on its own.
Hyperliquid’s fee spike gives buyers more than a chart
Hyperliquid generated approximately $6.2 million in fees on Aug. 23. DefiLlama reports about $5.86 million in application fees over the past 24 hours, alongside roughly $7.1 billion in perpetual-futures volume.
Those fees measure the platform’s trading activity, but they also feed into HYPE’s token mechanics. A portion goes to the Assistance Fund, which uses it to buy back HYPE. The acquired tokens are treated as burned and removed from the total and circulating supply.
Buybacks do not guarantee a price increase. They do create recurring demand while reducing supply, a dynamic that could support HYPE over time if Hyperliquid’s trading activity remains elevated.
That activity has stayed strong even as HYPE trades near record levels. The platform’s ability to operate through sharp volatility is part of its appeal to traders and liquidity providers; its response to an earlier market dislocation showed why it has become a serious venue for perpetual-futures trading.

Spot buyers are not carrying this market alone
The same data also explains why the pullback can move quickly. At the time of writing, CoinGlass showed roughly $4.4 billion in HYPE futures volume over 24 hours, compared with about $300 million in spot trading. Open interest was near $3.5 billion.
In other words, most of the day’s action came through leveraged contracts rather than simple spot purchases. That can accelerate gains when momentum is strong. It also leaves more traders vulnerable if the breakout floor gives way and long positions begin to close.
There is no need to turn every pullback into a bearish signal. HYPE remains close to its record, and Hyperliquid’s fee generation gives the move a stronger basis than pure hype. But still the next move depends on whether buyers can defend the prior high before the derivatives market decides the level for them.
This article is provided for informational purposes only and does not constitute investment advice.



Kosta has reported on cryptocurrency markets and blockchain infrastructure since 2020, bringing over six years of hands-on experience in the crypto industry built through daily tracking of markets, trends, and emerging blockchain developments. Specializing in Bitcoin on-chain analysis, institutional ETF flows, and digital asset price action, his work at Coindoo has been cited by other news agencies and consistently covers market developments with a focus on data-driven reporting across Bitcoin, Ethereum, Solana, and XRP. Over the years, Kosta has contributed to multiple crypto media outlets in different regions, authoring over 6,000 articles across the sector. His reporting spans cryptocurrency markets and the broader fintech industry, tracking not only price action but also the technological and regulatory forces shaping the ecosystem. To support his analysis, Kosta actively leverages on-chain data and metrics from leading platforms such as Santiment, Glassnode, and CryptoQuant, enabling deeper, evidence-based market insights. He believes in the power of transparency and the data that underpins the blockchain ecosystem. His academic background in Marketing Management from Denmark further complements his analytical approach, adding a strong understanding of communication strategy and content positioning to his work.