Gold’s Crash Weakens the Case Against Bitcoin

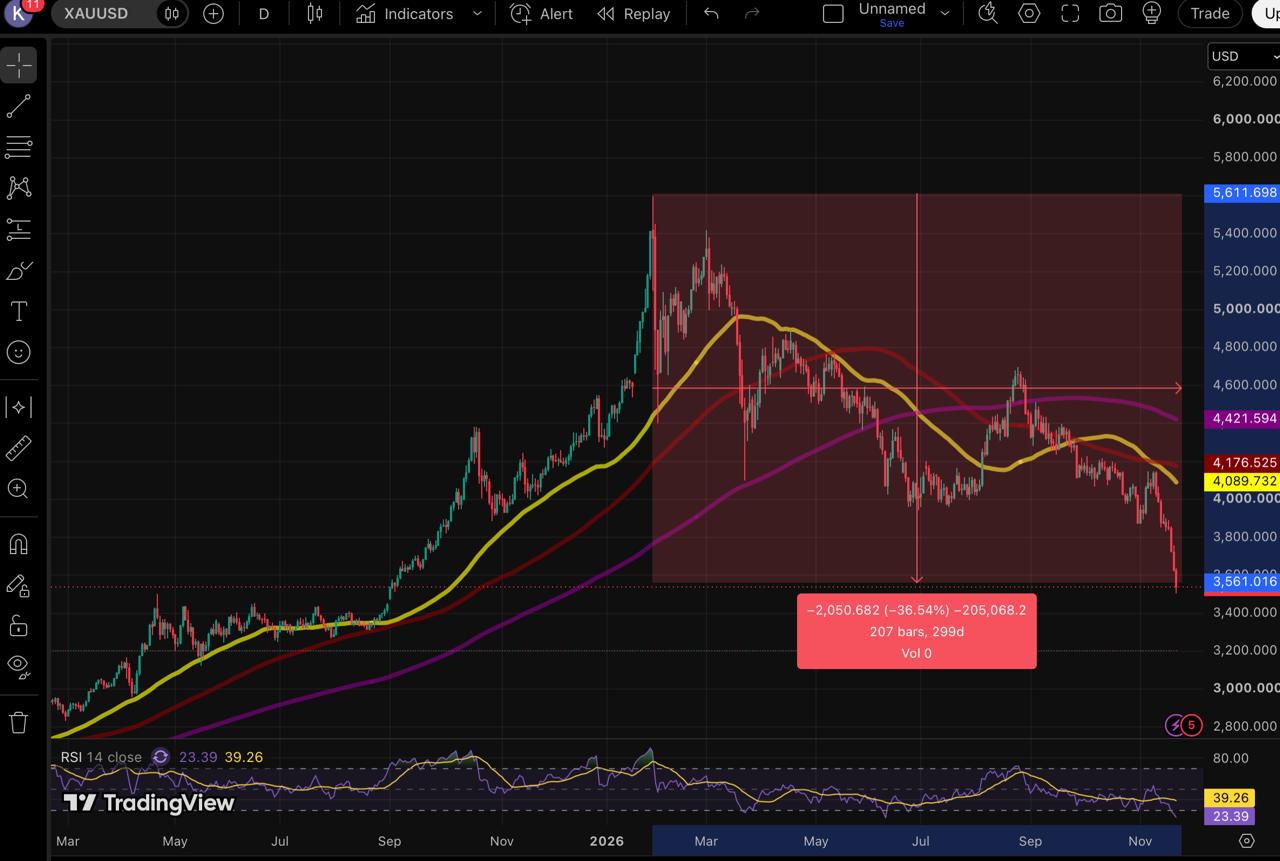
Gold has lost more than a third of its value since late January, which weakens a favourite argument against Bitcoin: that a genuine store of value does not crash.
Key Takeaways
- Gold has lost over a third since January
- Per trading session, gold is falling faster
- Bitcoin’s slide is shallow by its standards
- Gold is falling despite war and inflation fears
The latest leg lower started when gold slid almost 3% on November 12 to its lowest level since October 2025, as fading hopes of Middle East peace pushed oil higher and revived inflation fears.
The usual case against Bitcoin as a store of value is that it falls too far and too fast. In February, with gold up about 20% for the year and Bitcoin down, critics such as former White House budget director David Stockman held up the contrast as proof of which asset stores value. Gold, the asset that defines the category, is now failing a version of that test, and it is doing so under the very conditions that are supposed to favour it. Whatever yardstick rules Bitcoin out has to be applied to gold as well.
Two Drawdowns, Side by Side
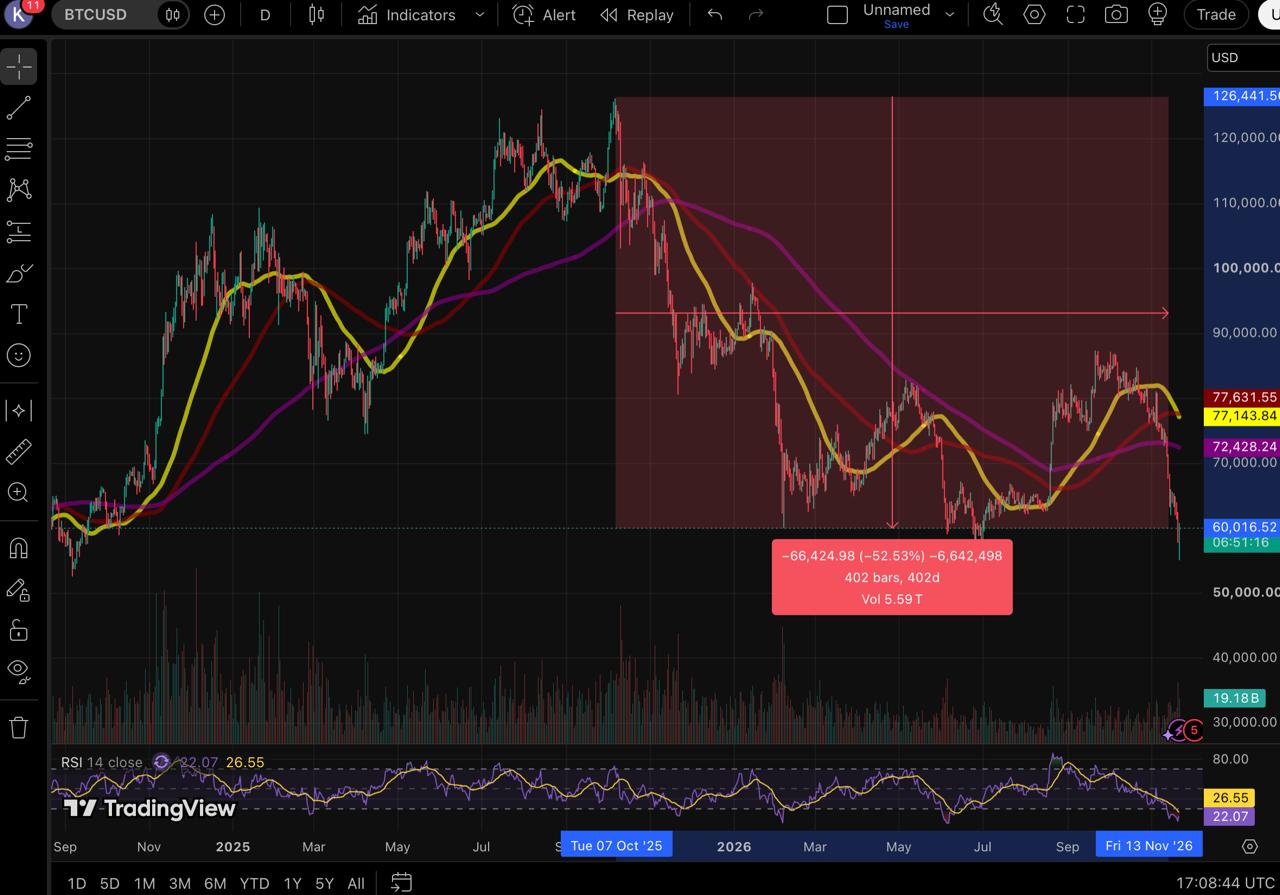
Measured from each asset’s record high, the two declines compare as follows:
Daily rates are compounded. Gold trades on weekdays (207 sessions in this decline); Bitcoin trades every day, so its two rates are the same.
For gold, the slide has erased the final stage of its run. The metal now trades roughly where it peaked in April 2025 and where it stood in early September 2025, just before the surge toward record highs. BullionVault calculates that, on London’s 3pm auction price, gold fell 15.1% in the 12 weeks to November 13. That was its fifth-steepest drop among non-overlapping 12-week stretches in 20 years, with losses in 10 of those weeks.
Bitcoin is back in the zone of its June and July 2026 lows. Its 12-month low of $58,566, set on July 1, was 53.7% below the record, leaving the current drawdown just over a percentage point from that floor.
Gold Is Falling for the Reasons It Should Rise
Conflict and rising prices are meant to push investors toward gold. This time they are hurting it, through interest rates. Higher oil prices have lifted inflation expectations, and traders now treat a Federal Reserve rate hike in December as close to certain. The dollar index reached 103.82 on November 18, its highest level since April 2025. Gold pays no yield, so higher expected rates make it more expensive to hold.
Fund flows show who is selling. US-listed gold ETFs recorded their second-largest first-half outflow in dollar terms on record this year, and North American funds were the only region to lose money in October. Elsewhere, buyers kept adding: World Gold Council data show global gold ETF holdings reached a month-end record of 4,275 tonnes in October, led by European funds, while Asian investors remained net buyers.
Bitcoin’s institutional selling has been concentrated in the same US market. US spot Bitcoin ETFs lost $1.91 billion over seven straight sessions from November 5 to 13. Bitcoin also faced pressure specific to crypto, as forced liquidations approached $2 billion in a single 24-hour period over the November 14-15 weekend, according to Decrypt.
Per Trading Session, Gold Is the Faster Faller
Because losses compound, the fair comparison is the steady daily rate that would produce each drawdown. Per calendar day, Bitcoin is falling about a fifth faster than gold. Most of its larger total comes from timing: its decline began in early October 2025, roughly three and a half months before gold peaked. Applied to gold’s 299-day window, Bitcoin’s rate would produce a loss of about 42%, six points more than gold’s.
Counting only days when each market trades reverses the order. Gold’s entire loss has come across weekday sessions, and on that basis it has been falling faster than Bitcoin. Its path has also been uneven: Trading Economics data show gold lost more than 13% in March alone, its steepest monthly decline since October 2008.
Bitcoin’s Slide Is Shallow by Its Own Standards
Set against its own history, Bitcoin’s current fall looks restrained. Its previous bear markets since 2013 each erased between three-quarters and five-sixths of the price over roughly a year, and this decline, measured to date, is the shallowest of them despite lasting about as long. The bigger difference is speed: compounded, those earlier collapses ran at 0.4% to 0.5% a day, two to almost three times this cycle’s rate.
Gold Has Spent Decades Underwater
Gold’s history shows how long a store of value can take to recover. After peaking near $850 in January 1980, it fell roughly 65% by mid-1982 and did not regain that nominal high until 2008, 28 years later. From its September 2011 high near $1,921, it lost about 45% by December 2015 and needed until 2020 to climb back. Buyers at either peak needed patience measured in years, and in the first case in decades.

Where Each Asset Still Has the Edge
Gold’s case starts with the central banks that hold it as a reserve asset and keep buying. Preliminary World Gold Council data show 63 tonnes of net central bank purchases in September, the heaviest monthly total in two years. Gold has also served as money for thousands of years, draws physical demand from jewellery and industry, and over most periods moves far less violently than Bitcoin.
Bitcoin’s case rests on a supply capped at 21 million coins, easy movement across borders, and settlement at any hour of any day. Against that, it has less than two decades of history, and its price still reacts more sharply to swings in risk appetite and leverage.
What the Store of Value Test Should Measure
If the size of a drawdown alone could disqualify an asset, gold’s current fall and its 1980s collapse would already have done so. In practice, the label has always described recovery: an asset that regains its purchasing power over a holding period long enough to absorb declines of this scale.
Gold has passed that test over long horizons, though once it took 28 years. Bitcoin has gone on to set new highs after each of its previous bear markets, over a far shorter history. Neither record removes the risk of buying at a peak, and the holding period matters at least as much as the asset itself.
Levels on Both Charts
Both assets are deeply oversold, with daily RSI near 23 for gold and 22 for Bitcoin, and both trade below all three of their moving averages.
If buyers return
Gold would first need to reclaim the band around $4,090 to $4,177, where its two faster averages sit, with the slowest near $4,422. Bitcoin’s nearest average is around $72,428, followed by a cluster near $77,144 to $77,632.
If selling extends
A daily close below $3,561 would leave gold exposed to the range it traded in through spring and summer 2025. For Bitcoin, a break below $60,000 would bring the July low of $58,566 into focus.
The swing factor
The Federal Reserve’s December decision bears on both. These are conditions to watch, not calls on direction.
This article is for informational purposes only and does not constitute investment advice. Price levels describe chart conditions and are not forecasts.



Alex is Editor-in-Chief of Coindoo and co-founder of Millennial Media Group, with nearly a decade of experience covering financial markets - crypto first, then everything else. It started in 2016 with Bitcoin. Like most people at the time, he didn't fully understand it - so he kept digging. Blockchain, tokenomics, the projects, the cycles. That curiosity never stopped, and eventually pulled him into traditional markets too: equities, commodities, macro. Not because he left crypto behind, but because you can't properly understand one without the other. What drives him is straightforward: he wants to know why something is happening, not just that it's happening. Most market coverage stops at the headline - price up, price down, here's a chart. Alex finds that kind of reporting actively unhelpful. If you walk away from an article without understanding the mechanism behind the move, what did you actually learn? He holds a degree in Tourism from New Bulgarian University - not the most obvious path into financial markets, but markets have a way of pulling in people who are simply too curious to stay out. He has authored over 200 in-depth analyses and more than 10,000 articles across crypto and traditional finance. He still thinks every day in markets teaches him something new. That's probably why he hasn't stopped.