Ethereum’s Scarcity Index Hit an All-Time High in April: Price Is Now Testing What That Means

Ethereum's supply scarcity on Binance reached a record 2.47 in April, the highest reading in seven years of data, while price simultaneously sold off to $2,260. ETH has since recovered to $2,410, now approaching the resistance level that capped price on April 21.
Key Takeaways
- ETH’s Binance scarcity index reached an all-time high of 2.47 in April.
- The index has retreated but remains above 1, a level historically associated with price support rather than weakness.
- ETH recovered from its $2,260 low to trade near $2,410 on April 22.
- The recovery was supported by the largest volume candle since the April 17–18 peak.
- Resistance sits at $2,420, while RSI at 69.42 has crossed below its 70.23 signal line.
The Binance ETH scarcity index measures the relationship between available Ethereum supply on the exchange and demand for it. A reading above zero indicates that demand is exceeding the available supply, while a negative reading points to more supply than demand.
In April, the index reached 2.47, the highest level recorded across the seven years of data visible on the chart, which extends back to 2019.
The record appeared while Ethereum was correcting rather than setting a price high. Available supply was tightening as the price declined, creating a divergence between the exchange data and the market move.
The index has since fallen from 2.47 but remains above 1. The imbalance has therefore moderated without fully disappearing, leaving ETH with a tighter supply backdrop as it tests a major short-term resistance level.
ETH Returns to $2,420 With Momentum Starting to Fade
ETH fell from $2,460 on April 17 to a low of $2,260 on April 20, an 8% correction over three days.
The recovery accelerated on April 22, when the price moved from $2,320 to $2,420 in a single candle. Trading volume on that move was the highest recorded since the April 17–18 peak, confirming that buyers participated meaningfully in the rebound.
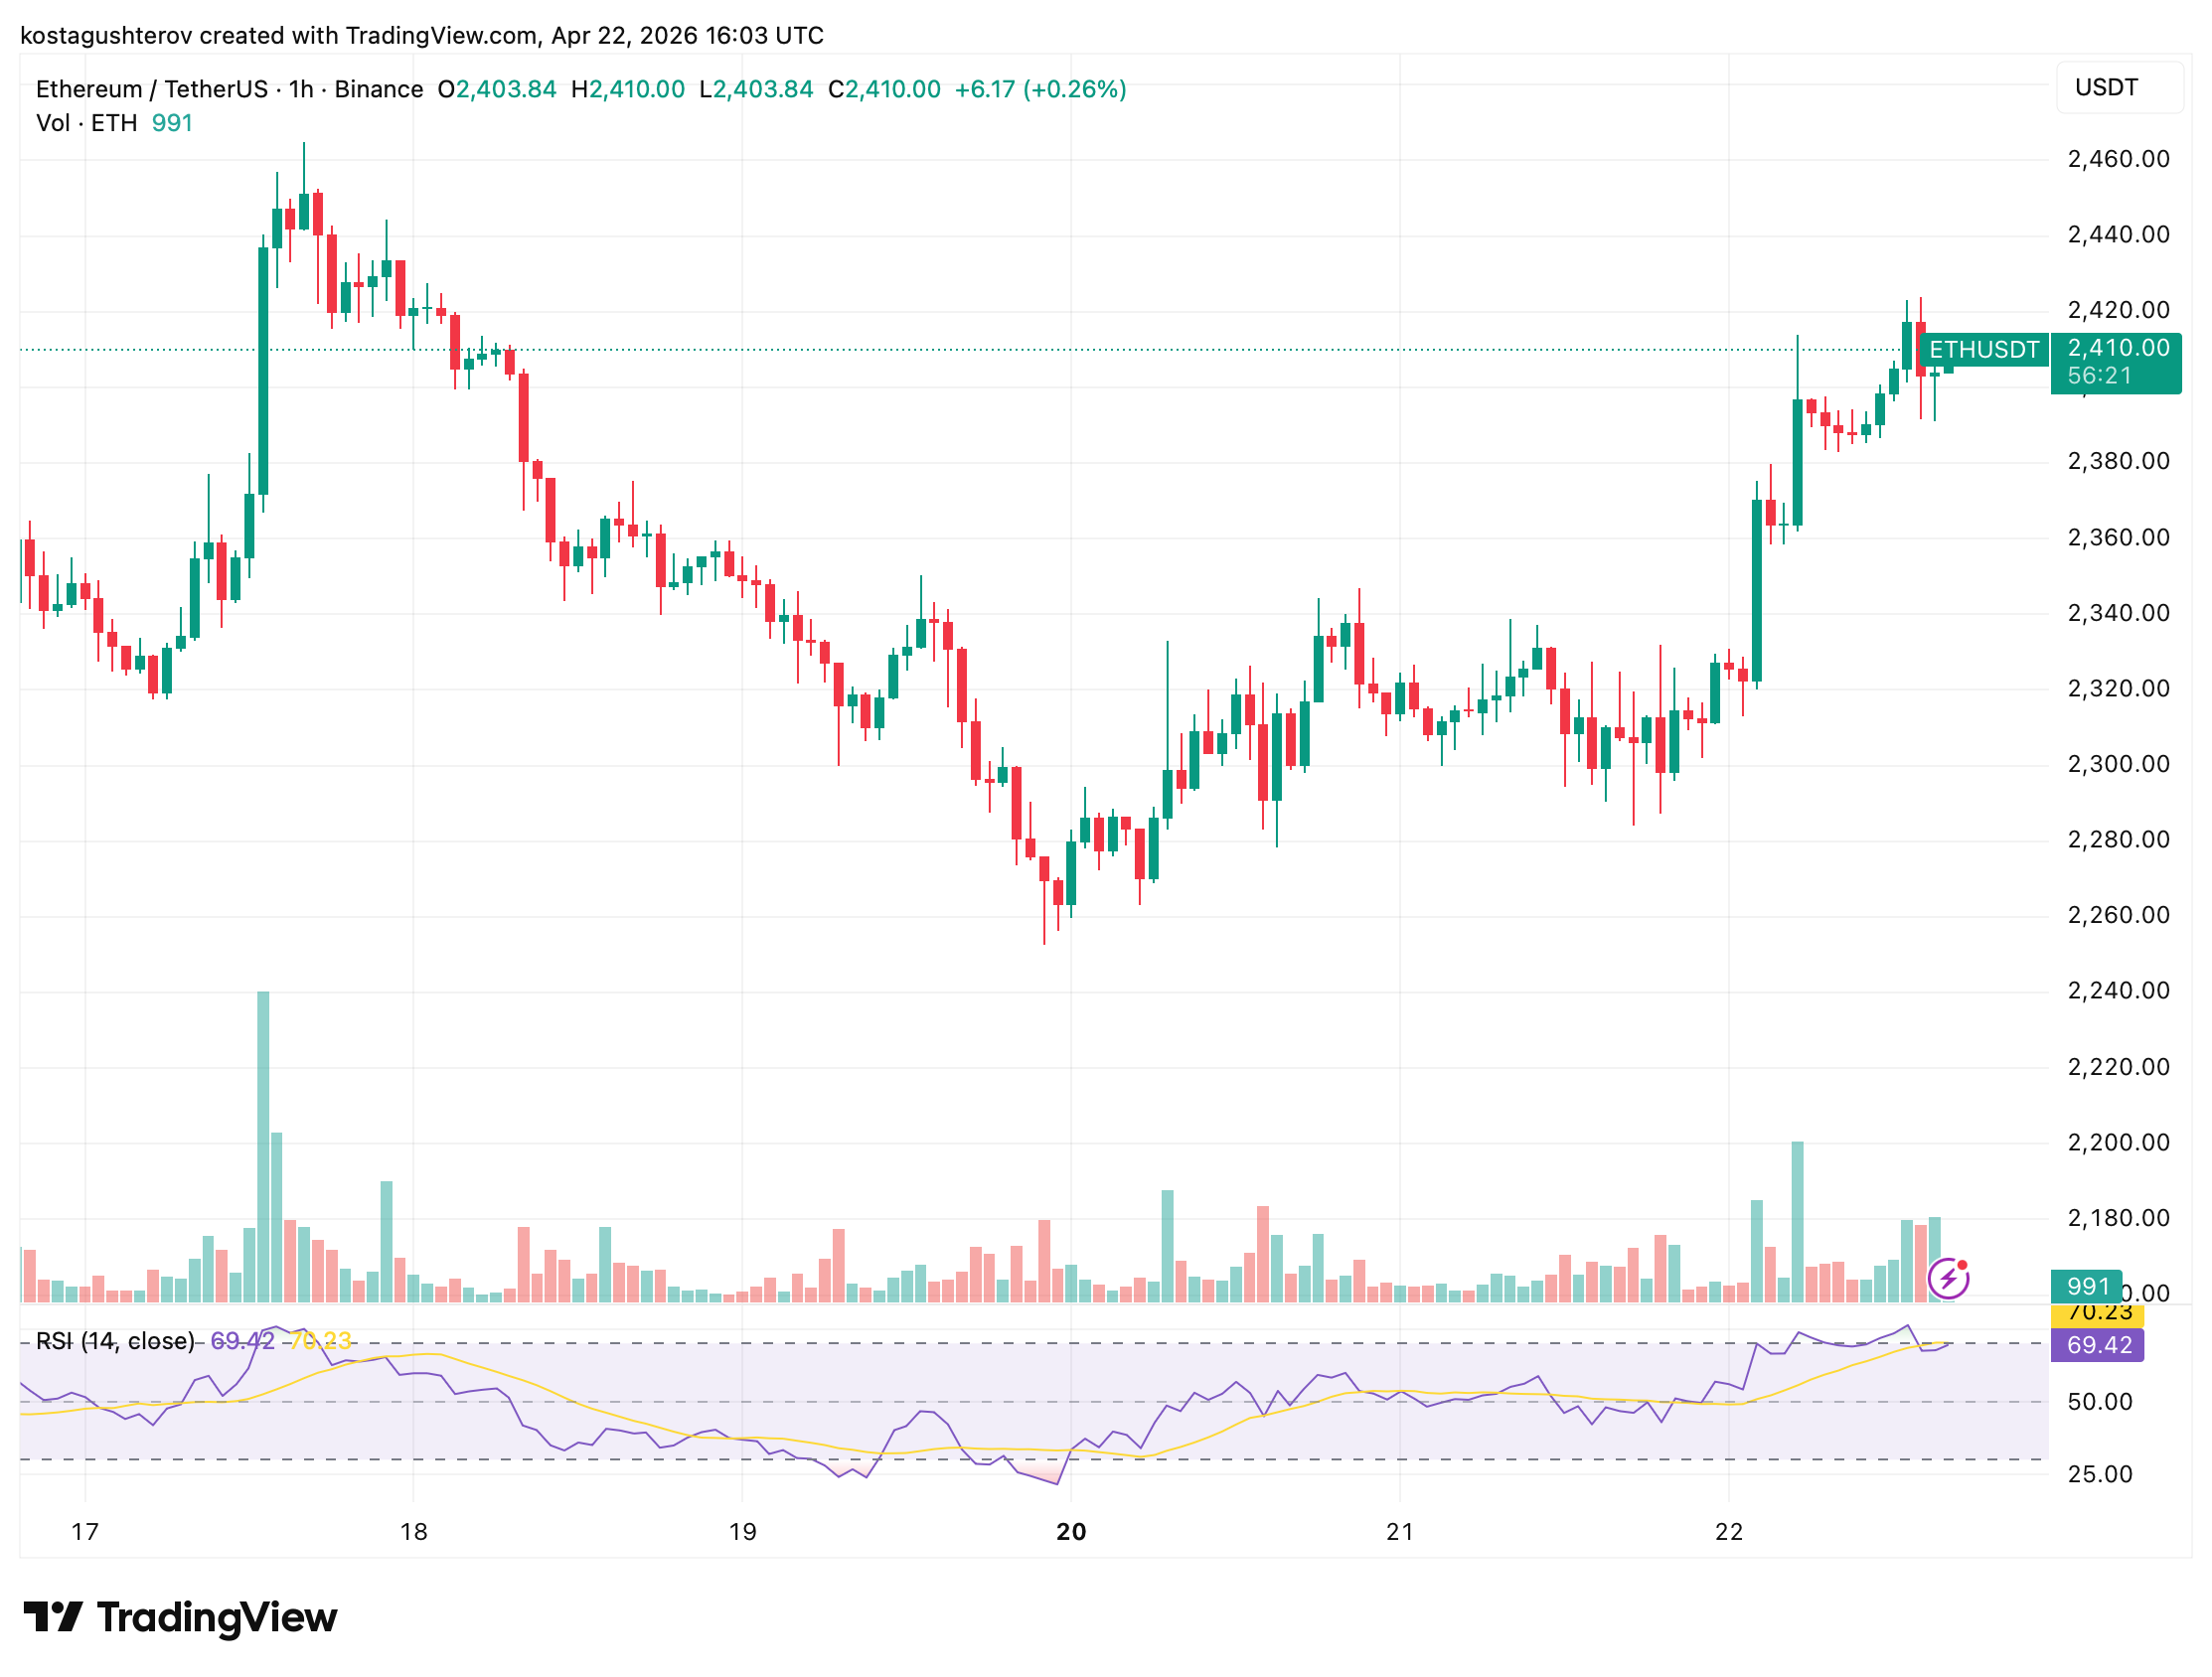
ETH was trading near $2,410 at the time of the analysis, directly below the horizontal resistance at $2,420 on the one-hour chart.
The RSI stood at 69.42 after crossing below its signal line at 70.23, the first such crossover since the recovery began. The indicator does not confirm a reversal on its own, but it shows that momentum is slowing at the same level where sellers previously emerged.
The recovery candle carried strong volume, while the candle that followed was smaller. Buyers pushed quickly into resistance but had not yet shown that they could maintain the same pace above it.

Scarcity Supports ETH, but Price Still Needs Confirmation
CryptoQuant’s scarcity index points to a structurally supportive supply setup. When available ETH on Binance is limited relative to demand, sellers have less immediately accessible supply to use against the market.

Readings above 1 have historically been associated with price stability or recovery rather than continued weakness. The current value therefore supports the rebound, but it cannot confirm that buyers will break through $2,420.
The price chart provides that confirmation test. A close above $2,420 followed by a successful hold would show that the reduced exchange supply is being matched by enough demand to push ETH through resistance.
A rejection would return the price to the $2,300–$2,380 range where it consolidated during the previous four days. That would not erase the scarcity signal, but it would show that the supply imbalance had not yet produced a sustained breakout.
The Next 24 Hours Could Test Whether Scarcity Led Price
The scarcity index reached its seven-year high while ETH was falling. A sustained move above $2,420 would make that record look like an early signal that supply conditions were improving before the price reacted.
If ETH is rejected and returns to the consolidation range, the 2.47 reading may instead represent a temporary imbalance that weakened before buyers could convert it into a breakout.
The index establishes the supply conditions. Price action around $2,420 will show whether the market is prepared to act on them.
The information provided in this article is for educational purposes only and does not constitute financial, investment, or trading advice. Coindoo.com does not endorse or recommend any specific investment strategy or cryptocurrency. Always conduct your own research and consult with a licensed financial advisor before making any investment decisions.



Kosta has reported on cryptocurrency markets and blockchain infrastructure since 2020, bringing over six years of hands-on experience in the crypto industry built through daily tracking of markets, trends, and emerging blockchain developments. Specializing in Bitcoin on-chain analysis, institutional ETF flows, and digital asset price action, his work at Coindoo has been cited by other news agencies and consistently covers market developments with a focus on data-driven reporting across Bitcoin, Ethereum, Solana, and XRP. Over the years, Kosta has contributed to multiple crypto media outlets in different regions, authoring over 6,000 articles across the sector. His reporting spans cryptocurrency markets and the broader fintech industry, tracking not only price action but also the technological and regulatory forces shaping the ecosystem. To support his analysis, Kosta actively leverages on-chain data and metrics from leading platforms such as Santiment, Glassnode, and CryptoQuant, enabling deeper, evidence-based market insights. He believes in the power of transparency and the data that underpins the blockchain ecosystem. His academic background in Marketing Management from Denmark further complements his analytical approach, adding a strong understanding of communication strategy and content positioning to his work.