Ethereum Derivatives Flushed Twice in April and the Market Feels Nothing
Ethereum's open interest collapsed across multiple exchanges for the second time this month. Three years of taker ratio data put the recovery in a context the short-term chart alone cannot provide.
Key takeaways:
- Second synchronized OI decline this month.
- Gate.io OI dropped $840M on April 18, still -$830M on April 20.
- Binance OI dropped $205M on April 18.
- Binance funding rate at -0.0045%, longs liquidated, not shorts squeezed.
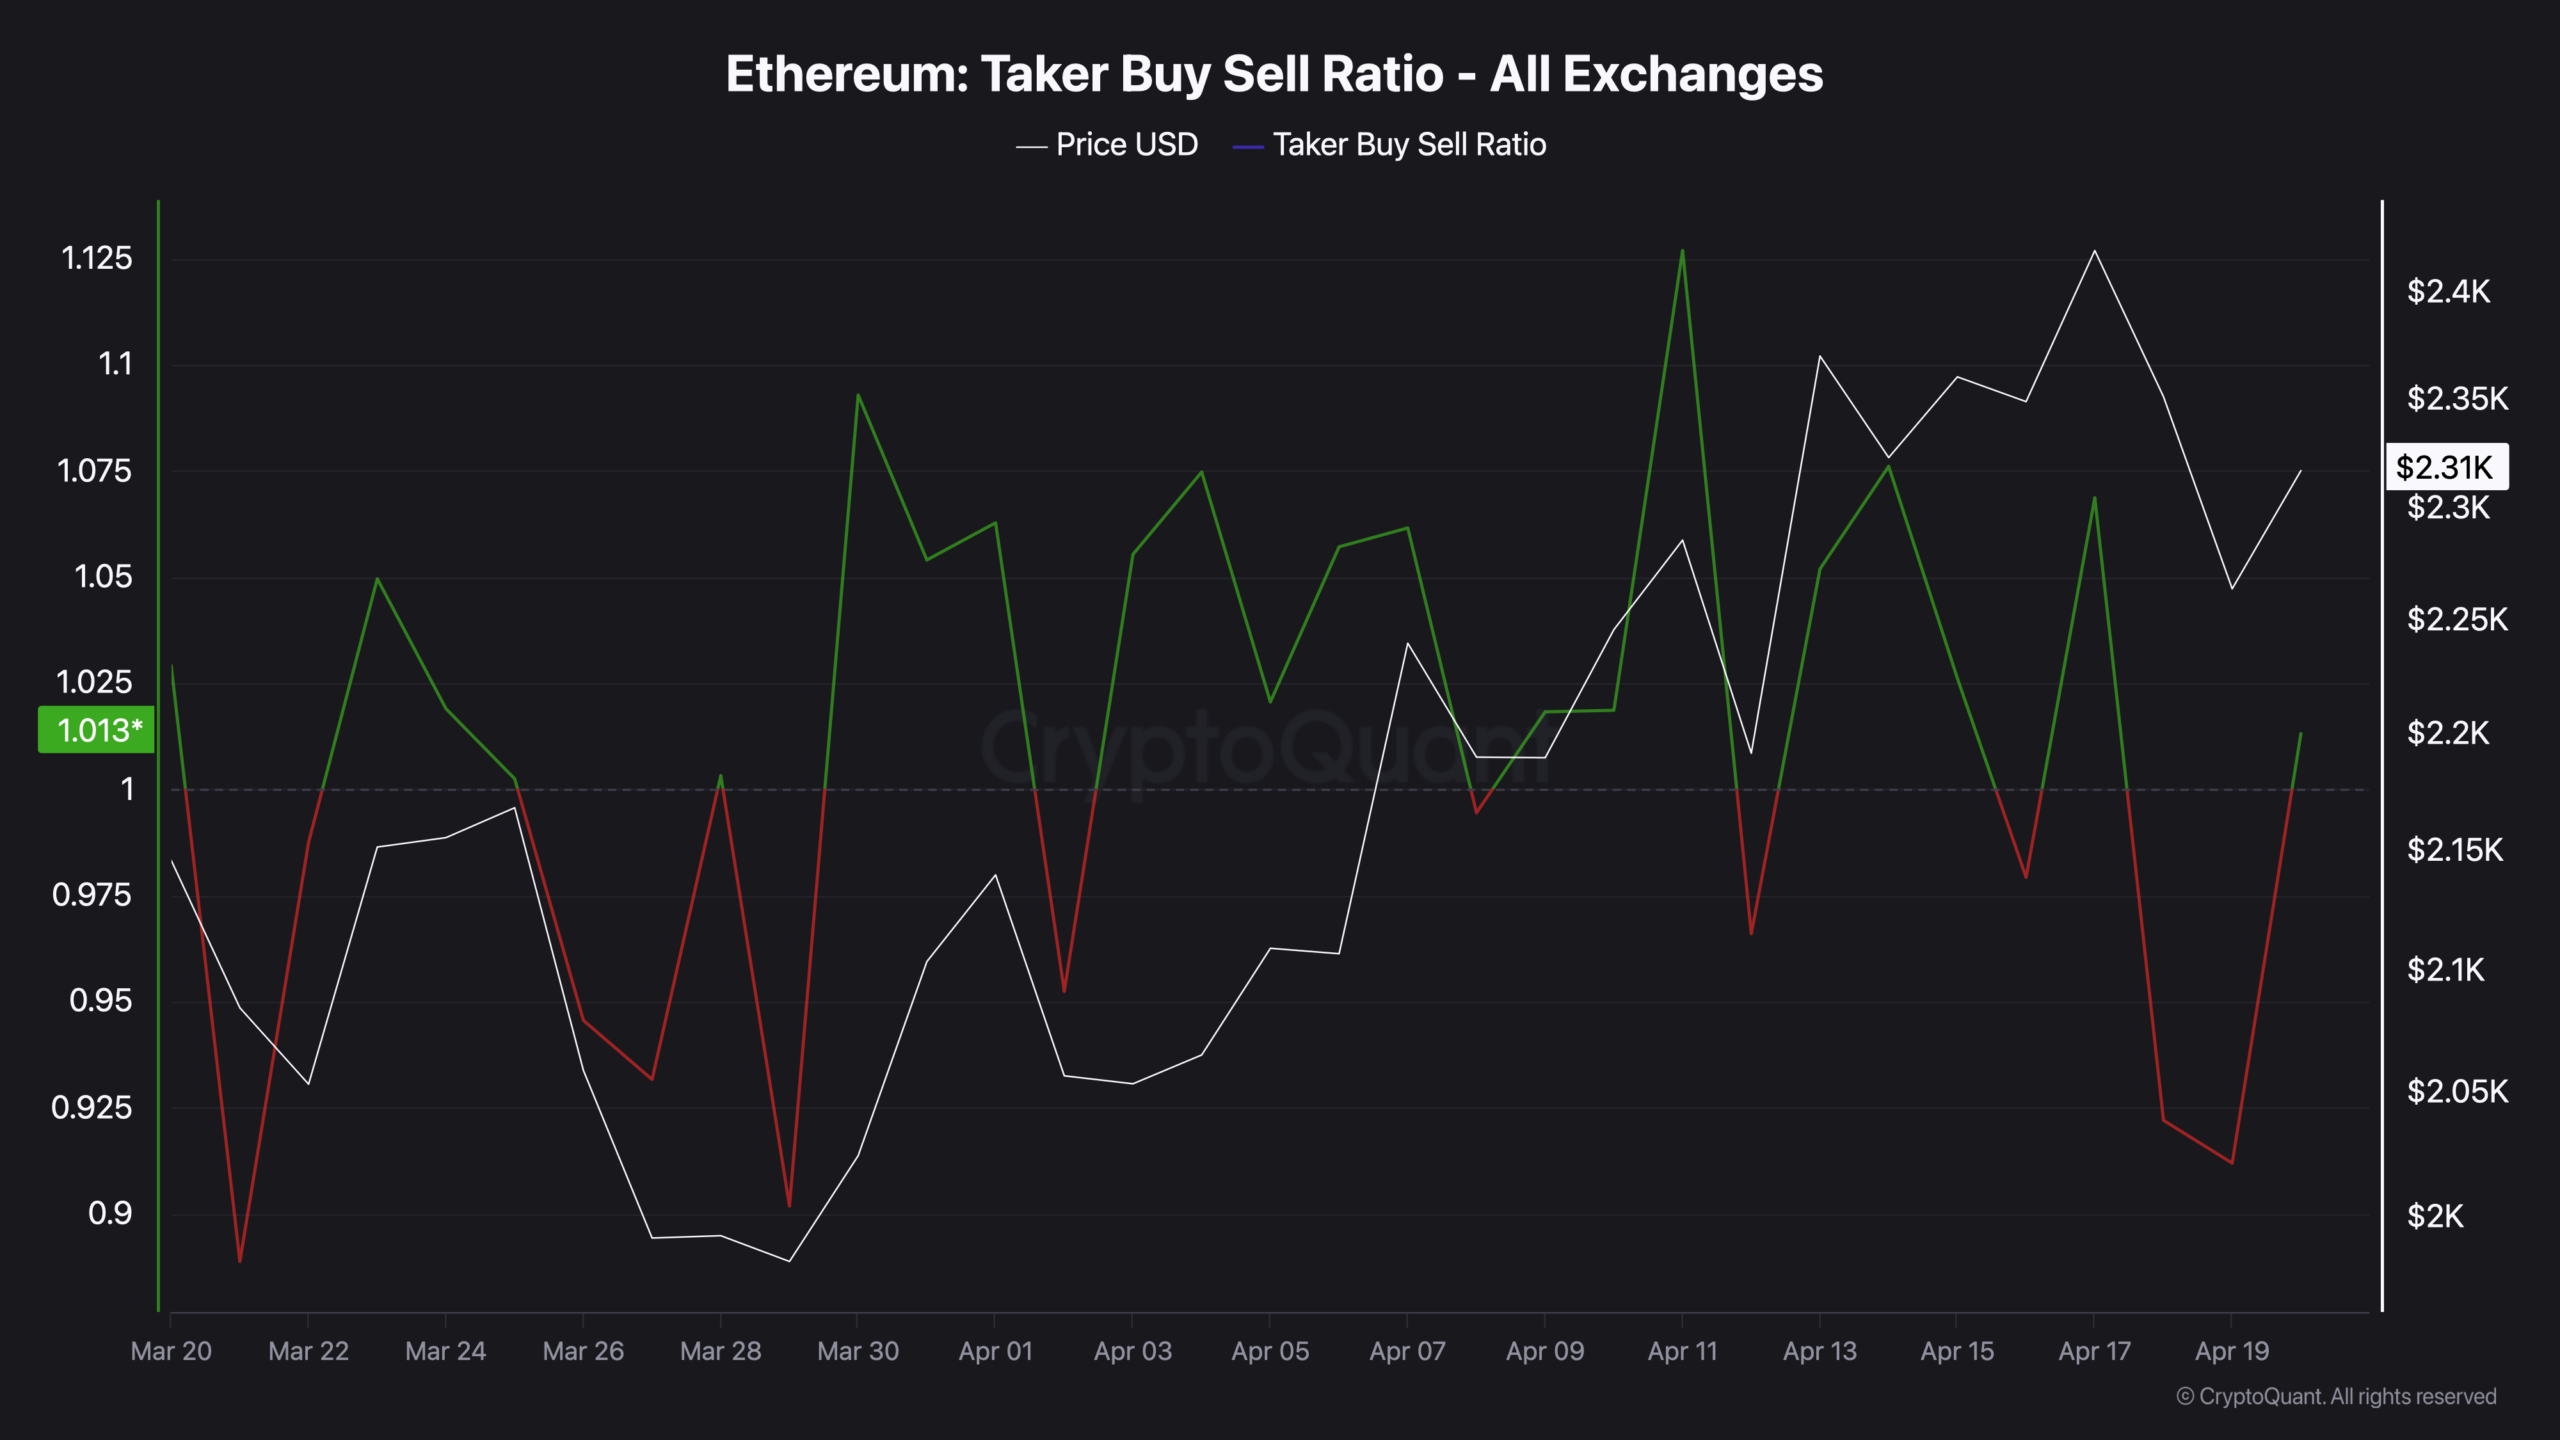
- Taker ratio collapsed to 0.916 on April 19, recovered to 1.013 on April 20.
- 3-year chart: 1.013 is mid-range neutral.
- Two leverage builds followed by two flushes in 18 days.
On April 18, Gate.io recorded approximately -$840 million in open interest change on Ethereum derivatives. Binance added another -$205 million the same day. By April 20, Gate.io’s reading remained near -$830 million, the pressure from that event had not cleared. These are the two largest negative OI readings in the entire visible dataset stretching back to late March. The April rally that took ETH to $2,425 built more leveraged positioning than any prior move this month, and the unwind reflected that proportionally.
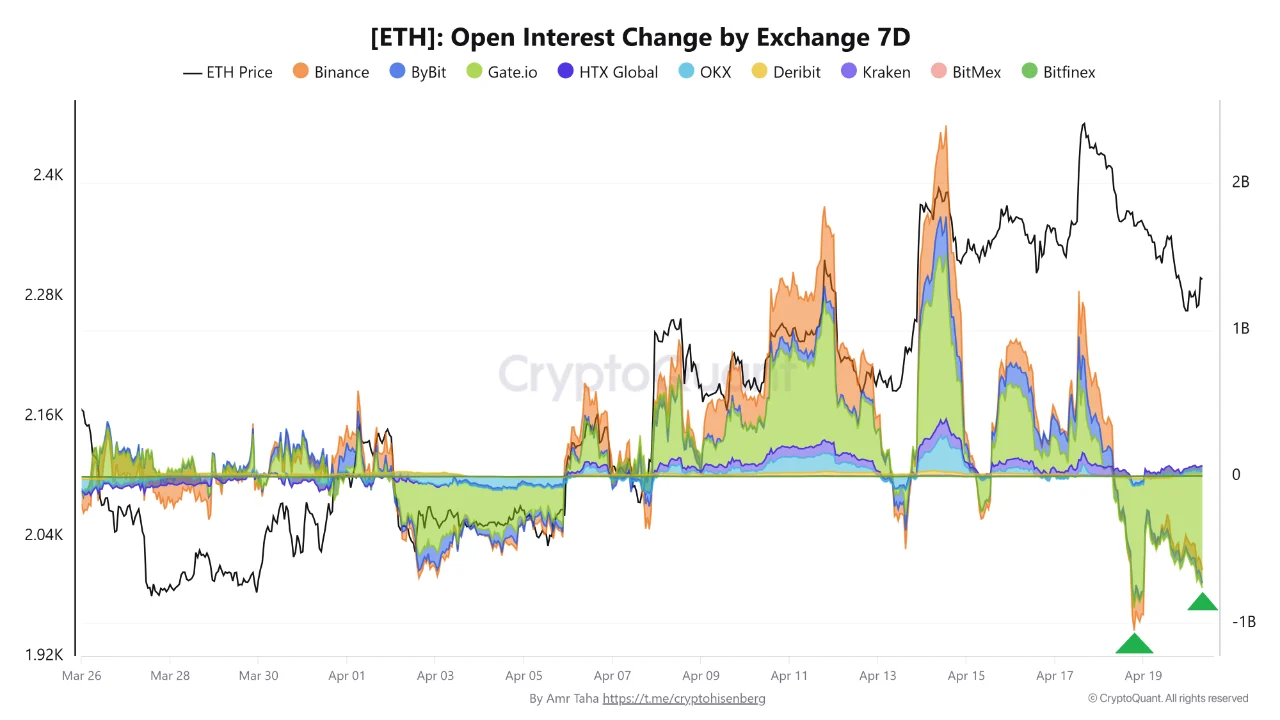
This was not the first time in April according to data from CryptoQuant. Between April 2 and April 5, ETH derivatives saw the first synchronized decline across exchanges. That flush cleared. OI rebuilt. Price pushed toward the weekly high. Then it happened again, larger. Two cycles of the same pattern in 18 days is not noise, it is a market that builds leveraged positioning and has it systematically removed.
Why longs got hit
The funding rate is what tells you which side of the trade took the damage. When funding is positive, longs pay shorts a periodic fee to keep their positions open, it signals crowded long positioning. When funding turns negative, that relationship reverses. Binance funding dropped to -0.0045% as OI was falling, and most other exchanges moved to or below zero starting April 13.
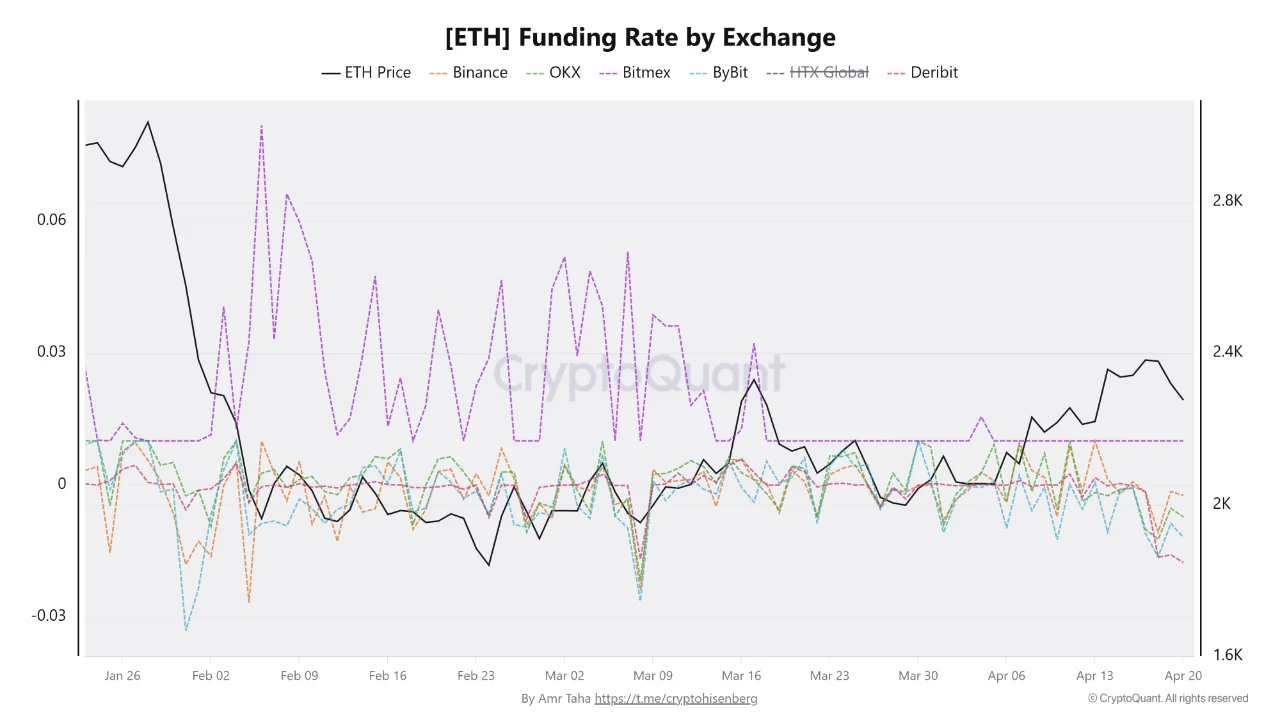
Negative funding alongside falling OI means the positions being closed were longs, either forced out by liquidation as price fell, or voluntarily unwound by traders who recognized the setup was repeating. This is a specific and important distinction. A short squeeze, shorts being forced to buy back, pushing price higher, would show falling OI with positive funding. What the data shows is the opposite: longs being removed, shorts absorbing the move.
The taker ratio registered that liquidation cascade in real time. The mechanics behind the April 19 collapse to 0.916 are now explicit, liquidated longs become market sell orders, and when enough of them hit simultaneously, the ratio drops hard and fast.
The taker ratio recovered
By April 20, the taker buy/sell ratio had recovered from 0.916 back to 1.013. On the short-term chart covering March 20 to April 19, that looks like a meaningful bounce, a return from aggressive selling territory back to buyer-dominated ground. The short-term chart is telling the truth. The liquidation wave has exhausted itself. Immediate selling pressure has passed.
The 3-year chart tells a different story about what 1.013 actually means. From 2023 through ETH’s 2025 cycle high near $4,800, the taker ratio spent the majority of its time above 1.05 during genuine accumulation and rally phases, with frequent spikes to 1.10-1.15 as momentum built. The red-dominated periods, ratios below 0.93 for extended stretches, corresponded to the 2025 price collapse to $1,500 and the deep correction phases. The current reading of 1.013 sits exactly at the midpoint of that three-year range. Not in red territory. Not in sustained green territory. Precisely on the fence.
The oscillation pattern visible across April, violent swings between 0.90 and 1.13 without either side sustaining dominance, is the on-chain signature of a market without conviction. Each spike above 1.05 attracted leveraged longs. Each collapse below 0.93 flushed them. The ratio returned to neutral after each event. In the twelve months preceding ETH’s 2024 rally from $1,500 to $4,000, the ratio floor rose from 0.875 to consistently holding above 0.95 between spikes , the baseline lifted before price did. Nothing analogous is visible in the current data. That pattern is not present here.

Two flushes cleared the leverage.
The source framing of this as a “leverage reset” is accurate as far as it goes. Repeated cross-exchange deleveraging does remove excess speculative positioning, it clears the crowded longs that would otherwise become an overhang on any attempted recovery. After two flushes in three weeks, ETH’s derivatives market is structurally cleaner than it was at the April 17 peak. Open interest has returned to its April 12 baseline. Funding is neutral to slightly negative. The overcrowded positioning has been removed.
What comes next depends entirely on what replaces it. If spot demand, actual buyers purchasing ETH without leverage, moving coins off exchanges into self-custody, begins absorbing the available supply, OI can rebuild on a healthier foundation and the taker ratio can sustain above 1.05 for the first time since the April rally began. That sequence is what the 3-year chart shows preceding every meaningful ETH price advance.
If instead leveraged longs rebuild quickly on thin spot support, the pattern completes its third iteration. The data as of April 20 does not yet show which path is being taken. The taker ratio at 1.013 is exactly neutral. The derivatives market is clean. The spot market has not yet declared its intention.
That declaration, not the next OI reading, is what the taker ratio is waiting to reflect.
The information provided in this article is for educational purposes only and does not constitute financial, investment, or trading advice. Coindoo.com does not endorse or recommend any specific investment strategy or cryptocurrency. Always conduct your own research and consult with a licensed financial advisor before making any investment decisions.

Kosta joined the team in 2021 and quickly established himself with his thirst for knowledge, incredible dedication, and analytical thinking. He not only covers a wide range of current topics, but also writes excellent reviews, PR articles, and educational materials. His articles are also quoted by other news agencies.