Ethereum Trades $18 Below its SMA50 as Exchange Supply Stays Near a 3 Month High

Ethereum is trading at $2,114 sitting $18 below the SMA50 at $2,132.11 while the Exchange Supply Ratio on Binance remains near its highest level since early February.
Key Takeaways
- ETH at $2,114.05 on the 1H chart, SMA50 at $2,132.11, gap of $18.06.
- SMA50 declining toward price: dynamic resistance converging, not static.
- Exchange Supply Ratio on Binance near 0.0320, highest since early February.
- RSI at 44.94, signal at 47.18: momentum marginally negative, no directional conviction.
Why this resistance level is moving toward price
The SMA50 is not standing still as resistance; it is declining toward price, which means the breakout threshold is falling and ETH does not need to rally to meet it, only to hold long enough for the MA to arrive.
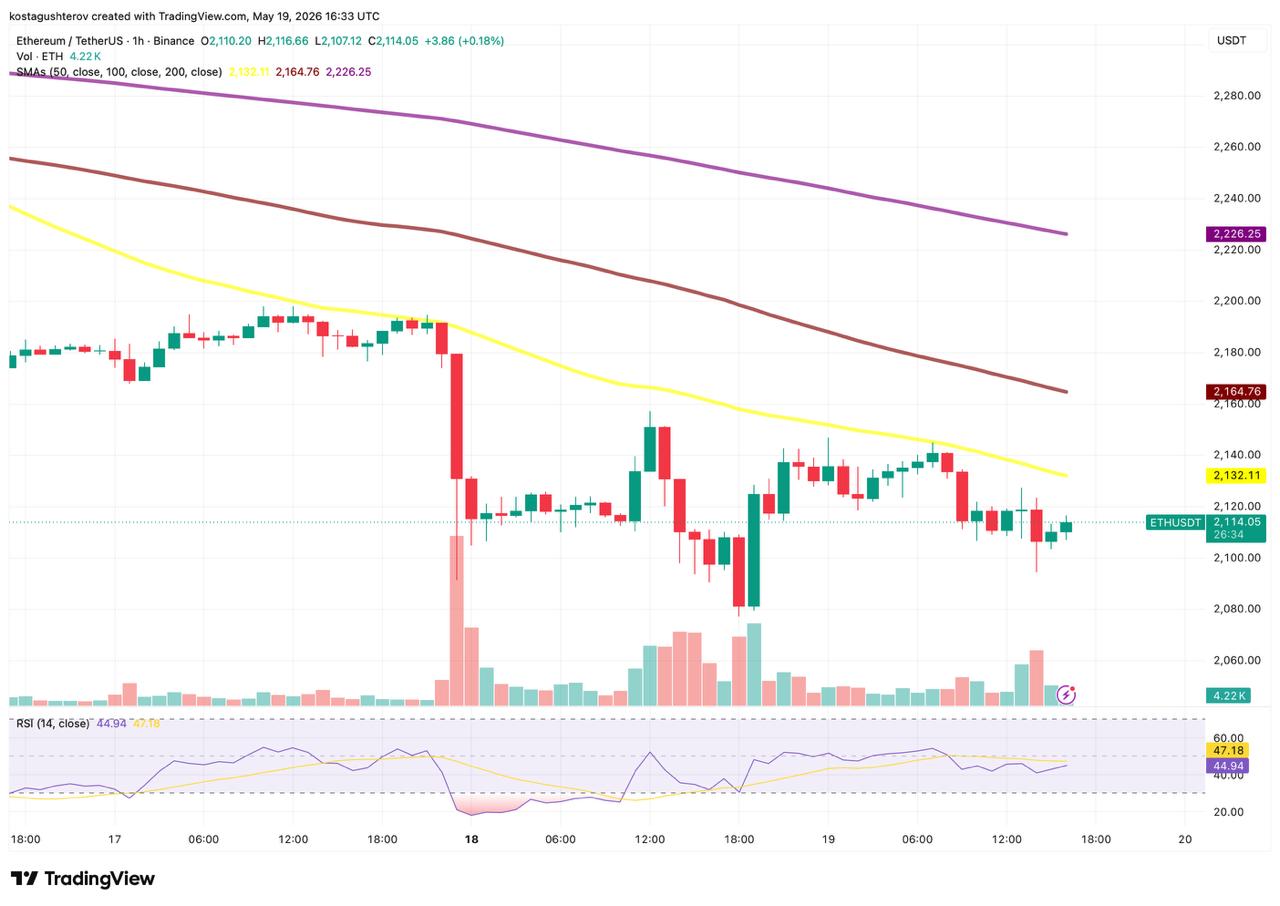
On the 1-hour chart, all three MAs are declining: the SMA50 at $2,132, the SMA100 at $2,164, and the SMA200 at $2,226. The SMA50 is the nearest and the one whose direction matters most for the immediate test. A sharp drop on May 18, accompanied by the largest volume bar in the visible range, pushed price below all three MAs. Since that drop, price has consolidated in a narrow range while the SMA50 has continued declining toward it.
Whether Ethereum holds above $2,132 when the SMA50 reaches current price, or whether the elevated supply available on Binance absorbs any attempt to push through, is what the next several hours will settle.
What the exchange supply ratio adds to the resistance picture
An Exchange Supply Ratio of approximately 0.0320 on Binance, still near its highest reading since February, means the supply available to absorb or reject any upward move is larger than it was during the March-April period when the ratio fell below 0.029 and price moved with less resistance.
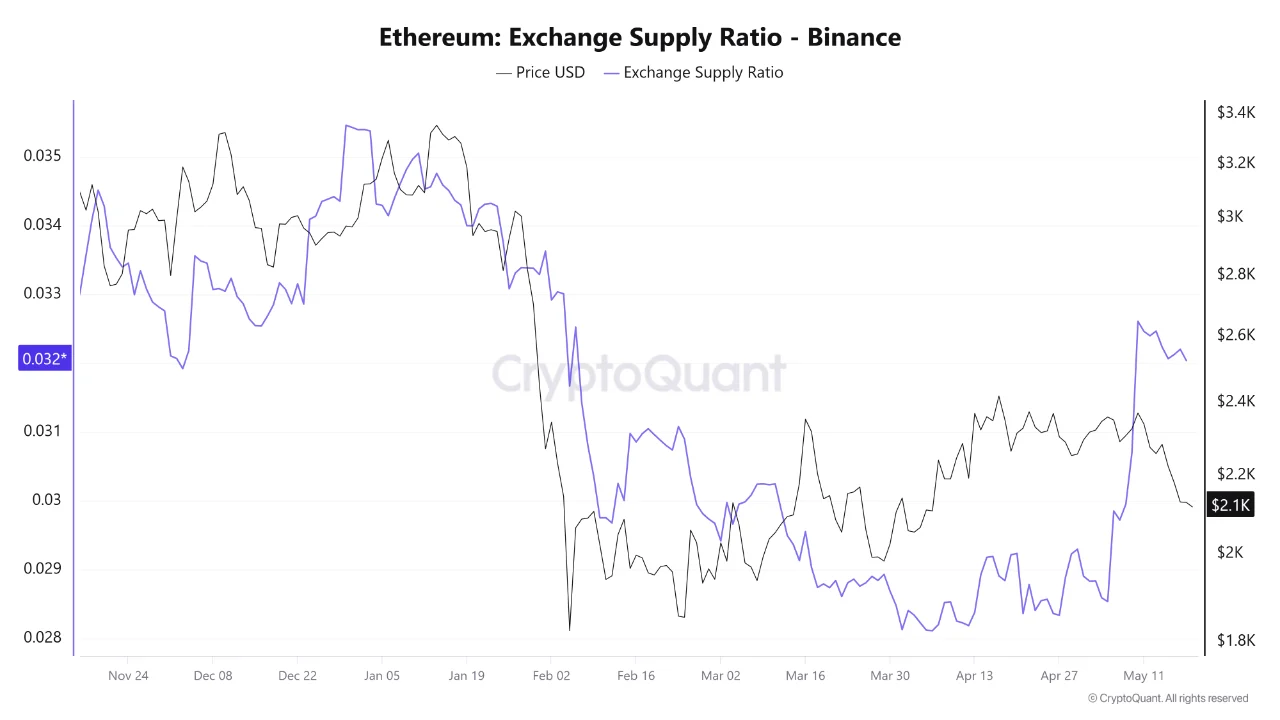
According to Arab Chain’s analysis of CryptoQuant data, the ESR peaked at approximately 0.0326 in May when ETH was trading near $2,370, then retreated to approximately 0.0320 as price declined. The source notes that elevated exchange supply does not necessarily indicate an immediate selloff but may increase the likelihood of volatility if selling pressure intensifies.
Analytically, holders who moved ETH onto Binance near the peak are currently sitting at a loss on that supply, a condition that creates a different selling dynamic than exchange supply accumulated at lower prices, where holders have more flexibility to wait.

The momentum read that makes this test different from a typical resistance test
At 44.94, the hourly RSI is below 50 but barely. The signal line at 47.18 sits only 2.24 points above it, a gap so narrow that the momentum picture has not committed to either direction. That indecision is not a neutral condition here: it means the SMA50 test will arrive without the RSI having already told the market which way to lean. Price will reach the MA in a state of unresolved momentum, which makes the reaction at that level more informative than a test that arrives with RSI already extended in one direction.
Volume on the current consolidation is light relative to the May 18 drop candle. A SMA50 break on comparable thinness would be structurally weak. A break accompanied by a volume expansion back toward the May 18 level would carry a different weight entirely.
If ETH pushes through $2,132 in the next six hours with volume expanding and RSI crossing above its signal line simultaneously, all three conditions, price, momentum, and participation, will have aligned on the bullish side of the test. If the SMA50 holds as resistance and price returns below $2,100, the consolidation will have been distribution rather than accumulation, and the next reference level is the $2,080 zone where buyers stepped in during the May 18 recovery.
The information provided in this article is for educational purposes only and does not constitute financial, investment, or trading advice. Coindoo.com does not endorse or recommend any specific investment strategy or cryptocurrency. Always conduct your own research and consult with a licensed financial advisor before making any investment decisions.

Kosta has reported on cryptocurrency markets and blockchain infrastructure since 2020, bringing over six years of hands-on experience in the crypto industry built through daily tracking of markets, trends, and emerging blockchain developments. Specializing in Bitcoin on-chain analysis, institutional ETF flows, and digital asset price action, his work at Coindoo has been cited by other news agencies and consistently covers market developments with a focus on data-driven reporting across Bitcoin, Ethereum, Solana, and XRP. Over the years, Kosta has contributed to multiple crypto media outlets in different regions, authoring over 6,000 articles across the sector. His reporting spans cryptocurrency markets and the broader fintech industry, tracking not only price action but also the technological and regulatory forces shaping the ecosystem. To support his analysis, Kosta actively leverages on-chain data and metrics from leading platforms such as Santiment, Glassnode, and CryptoQuant, enabling deeper, evidence-based market insights. He believes in the power of transparency and the data that underpins the blockchain ecosystem. His academic background in Marketing Management from Denmark further complements his analytical approach, adding a strong understanding of communication strategy and content positioning to his work.