DOGE Revisits the Shelf That Gave Way Before the Slide

Dogecoin’s burst toward $0.10 collided with the price shelf it lost before the May–July sell-off, setting up a decisive test of how much buying power sits beneath the rebound.
Key Takeaways
DOGE has reached the level it lost before the slide
DOGE climbed to an intraday high of $0.1007 on the Kraken daily chart, stopping just beneath the $0.1014 0.382 Fibonacci retracement. Buyers reached the doorstep of the level, but they did not take it.
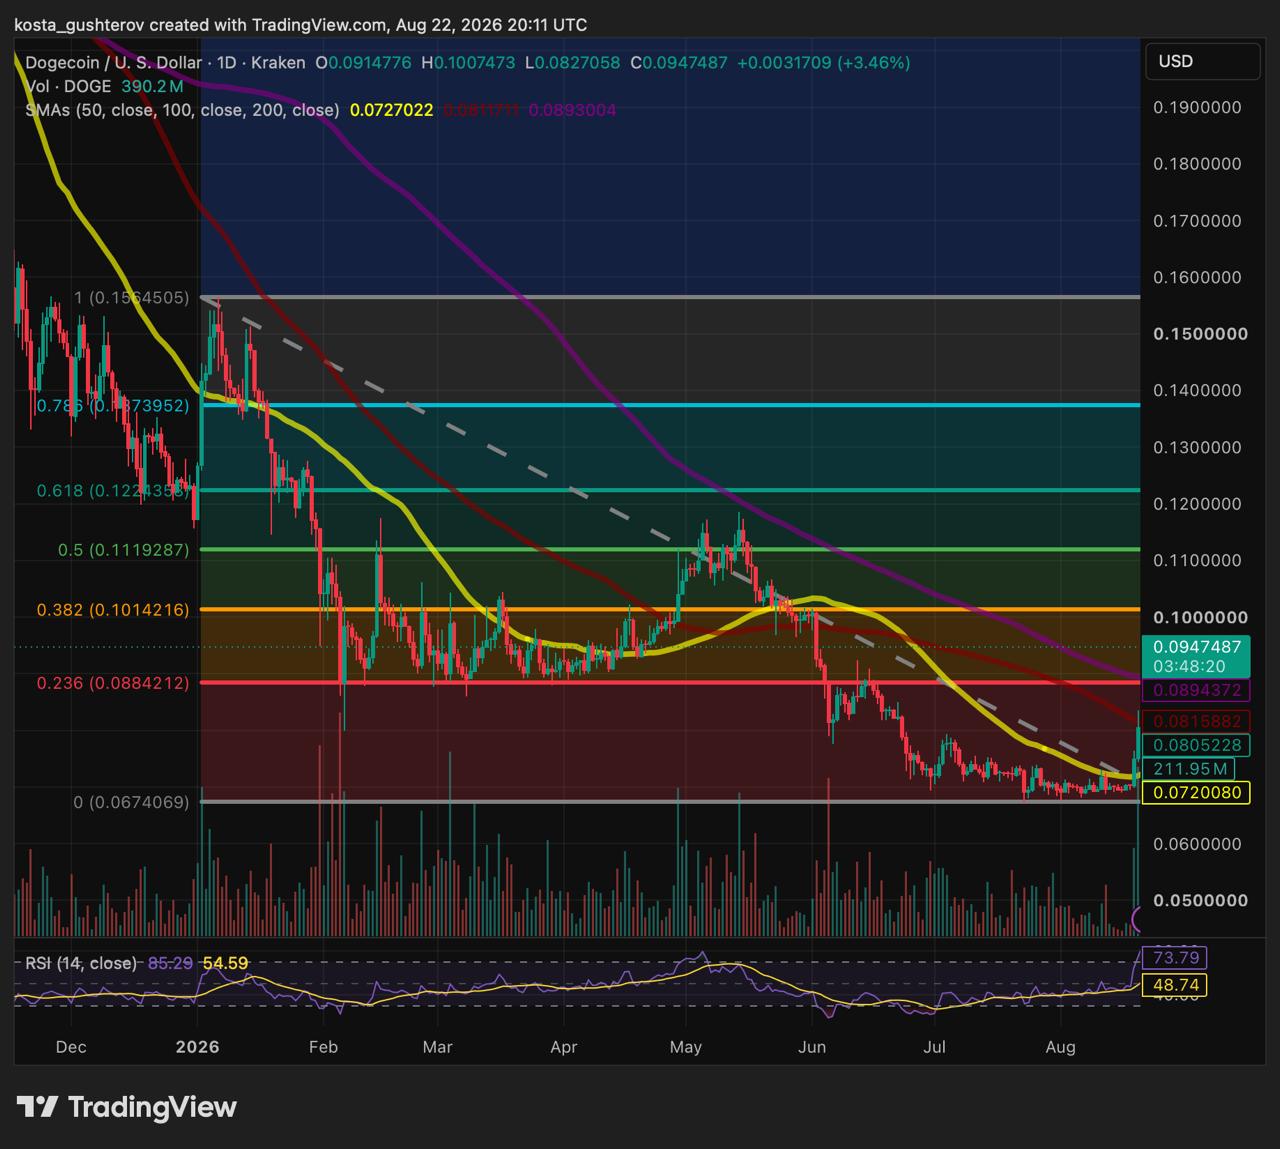
The $0.1014 line was not the exact peak of DOGE’s May recovery; price traded nearer $0.115 before rolling over. It was, however, the shelf that gave way as that recovery unraveled. Once DOGE slipped beneath it, the decline gathered pace and eventually pushed the token into the low $0.07s. Traders who were trapped during that break now have a natural place to sell into strength.
That history gives the current encounter more weight than a routine Fibonacci test. A second intraday wick would leave the same question unanswered. DOGE needs a daily close above $0.1014 and follow-through above the line before the market can treat the level as reclaimed support. The next Fibonacci marker sits near $0.1119.
The price jumped above the averages
DOGE now trades above its 50-, 100- and 200-day simple moving averages after the sharp rebound. The arrangement underneath price still belongs to a downtrend: the 50-day average sits near $0.0727, below the 100-day average around $0.0817, while the 200-day average remains higher at roughly $0.0893.
That bearish stack does not invalidate the rally but shows how quickly price has moved relative to the broader trend. A sustainable reversal usually gives those averages time to flatten and reorder; a sharp squeeze can clear all three without changing the larger structure underneath.
$0.088-$0.089 is where buyers have to show up
The first pullback has a clear landing zone. The 0.236 Fibonacci retracement stands at $0.0884, almost directly alongside the 200-day average at $0.0893. DOGE would arrive there with a former technical barrier and its longest daily moving average compressed into less than one cent of price range.
A retreat into that pocket would not damage the setup by itself. Markets often test a breakout before deciding whether it has legs. The quality of the response matters more: buyers need to defend the area on a daily closing basis and push price back above it, rather than allow $0.088-$0.089 to become fresh resistance.
A close below the cluster would put the 100-day average near $0.0817 back on the chart. Losing that level would leave the 50-day average around $0.0727 and the $0.067 swing base as the next supports, returning DOGE to the lower end of the range it only recently escaped.
Most of the trading is happening in futures
CoinGlass recorded roughly $6.09 billion in DOGE futures volume over 24 hours, against about $1.03 billion in spot volume. Futures activity was therefore nearly 5.9 times larger than cash-market turnover. Open interest stood near $1.57 billion, and about $44.3 million in DOGE positions were liquidated during the same period.
The ratio does not reveal whether longs or shorts will win the next move. It does show where the market is doing most of its price discovery. A futures market this large can extend a breakout quickly, but it can also turn a modest rejection into a violent move when margin positions start closing.
The healthier version of a pullback would see open interest level off or ease as DOGE revisits $0.088–$0.089. That would suggest positions are being cleared while buyers absorb supply. Rapidly rising open interest under $0.1014 would be a different picture: more leverage entering just as price is struggling with established overhead supply.

DOGE has ETFs, but not a deep institutional bid
Dogecoin now has regulated investment products, yet their scale remains limited. REX-Osprey’s DOJE reported $10.84 million in fund assets as of August 20. Grayscale’s GDOG showed $7.90 million, while 21Shares’ TDOG held $2.20 million as of August 19.
Combined, the three funds held roughly $20.9 million – about 0.13% of DOGE’s nearly $16 billion market value. Fund assets do not measure daily inflows, but they do show the size of the regulated capital pool behind the asset. DOGE has an ETF wrapper; it does not yet have a large, persistent institutional buyer that can absorb a breakout without help from the wider spot market.
ETF access gives traditional-account investors a route into DOGE. Yet the existing funds are too small to carry an attempted break above $0.10 by themselves. Once fast-money traders step back, the spot market must absorb the selling.
What could change the picture from here
- Close above $0.1014: DOGE reclaims the shelf lost during the May breakdown and brings $0.1119 into focus.
- Hold $0.0884-$0.0893: A retest that closes back above the 200-day average would give the rebound structural credibility.
- Lose $0.0817: A break below the 100-day average would show that the $0.088 support cluster failed to attract enough demand.
- Return to $0.0727-$0.067: That move would place DOGE back in the old range and weaken the case for a lasting trend change.
DOGE is no longer sitting in the July base near $0.07, and Friday’s surge has forced price above moving averages that pressed on the market for months. The averages have not yet turned, fund assets remain thin, and derivatives account for most of the trading activity. A controlled dip into $0.088–$0.089 would give buyers their chance to prove the rebound has substance. A failure there would turn the rush toward $0.10 into the first rejection of the old range, not the start of a new one.
Methodology: Fibonacci levels, moving averages, volume and RSI are taken from the Kraken DOGE/USD daily chart created on August 22, 2026, at 20:11 UTC. Derivatives and spot-market data is from CoinGlass, reviewed on August 22. ETF asset figures are from issuer pages dated August 19–20 and can change daily.
This article is provided for informational purposes only and does not constitute investment advice.



Alex is Editor-in-Chief of Coindoo and co-founder of Millennial Media Group, with nearly a decade of experience covering financial markets - crypto first, then everything else. It started in 2016 with Bitcoin. Like most people at the time, he didn't fully understand it - so he kept digging. Blockchain, tokenomics, the projects, the cycles. That curiosity never stopped, and eventually pulled him into traditional markets too: equities, commodities, macro. Not because he left crypto behind, but because you can't properly understand one without the other. What drives him is straightforward: he wants to know why something is happening, not just that it's happening. Most market coverage stops at the headline - price up, price down, here's a chart. Alex finds that kind of reporting actively unhelpful. If you walk away from an article without understanding the mechanism behind the move, what did you actually learn? He holds a degree in Tourism from New Bulgarian University - not the most obvious path into financial markets, but markets have a way of pulling in people who are simply too curious to stay out. He has authored over 200 in-depth analyses and more than 10,000 articles across crypto and traditional finance. He still thinks every day in markets teaches him something new. That's probably why he hasn't stopped.