CoinGlass Q1 Report Shows Growing Concentration in Crypto Exchange Market

The CoinGlass 2026 Q1 Cryptocurrency Market Share Research Report provides a detailed look at how trading activity, open interest, liquidity, and user assets are distributed across major cryptocurrency exchanges.
Key Takeaways
- Derivatives trading continues to dominate overall crypto market activity.
- Binance leads across trading volume, open interest, and user assets.
- Spot market competition is more distributed than derivatives.
- Exchange market structure shows a clear tiered hierarchy.
The Coinglass report shows that while overall market activity remained relatively high in the first quarter of 2026, trading volumes gradually declined from the peak levels seen in January. At the same time, the competitive structure of the exchange market remained largely unchanged, with Binance maintaining a leading position across multiple core metrics. More importantly, the data suggests that the crypto exchange industry is becoming increasingly concentrated around a small number of large platforms, while derivatives markets continue to drive the majority of trading activity.
Market Activity Shows Derivatives Still Drive Crypto Trading
Data shows that total cryptocurrency trading volume reached approximately $20.57 trillion in Q1 2026. Of this total, around $1.94 trillion came from spot trading, while approximately $18.63 trillion came from derivatives trading. This means derivatives trading volume was nearly ten times larger than spot trading volume during the quarter.
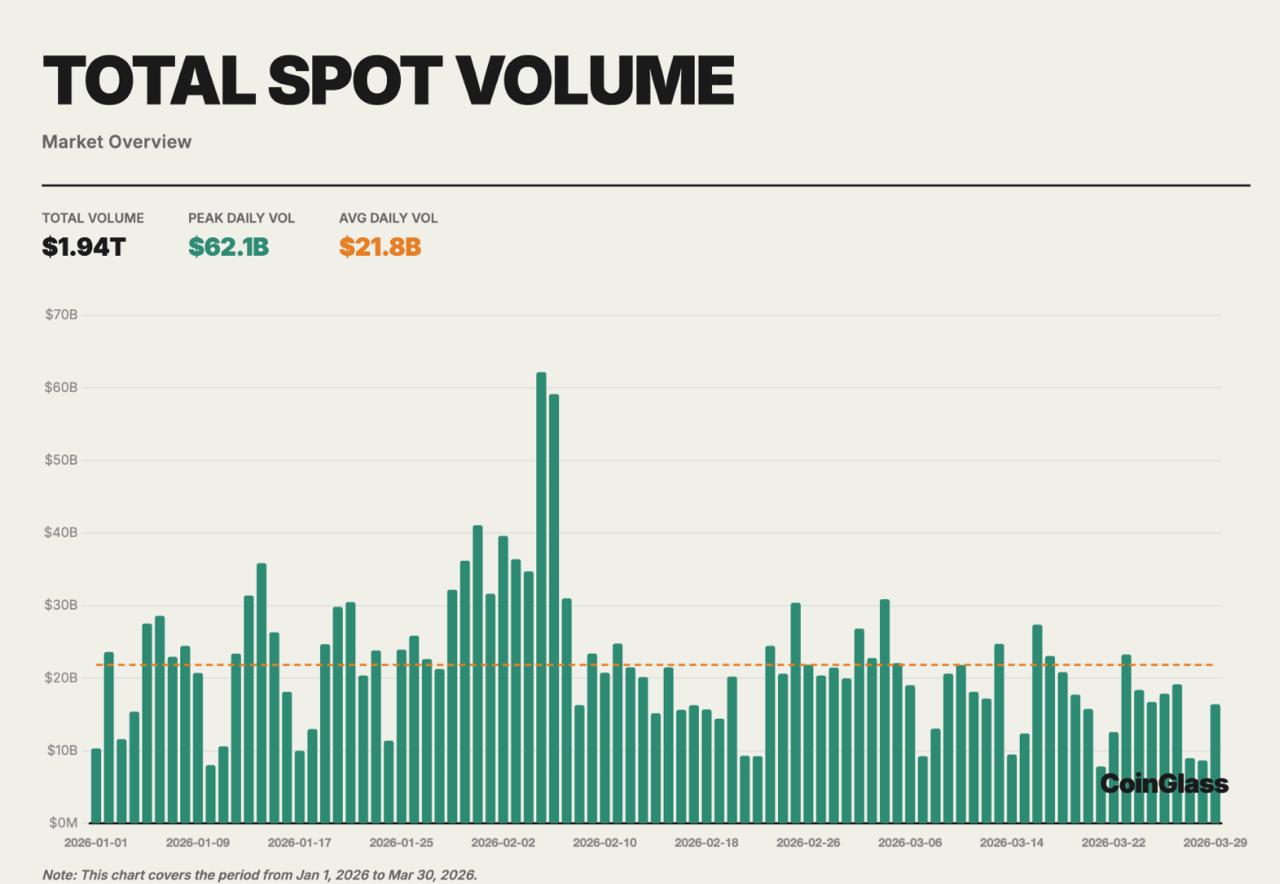
Total spot trading volume reached approximately $1.94 trillion, with peak daily spot volume reaching around $62.1 billion and average daily spot volume of approximately $21.8 billion. Spot activity was strongest in January and gradually declined through February and March, suggesting that early-year activity was driven by volatility and repositioning rather than sustained new capital inflows.
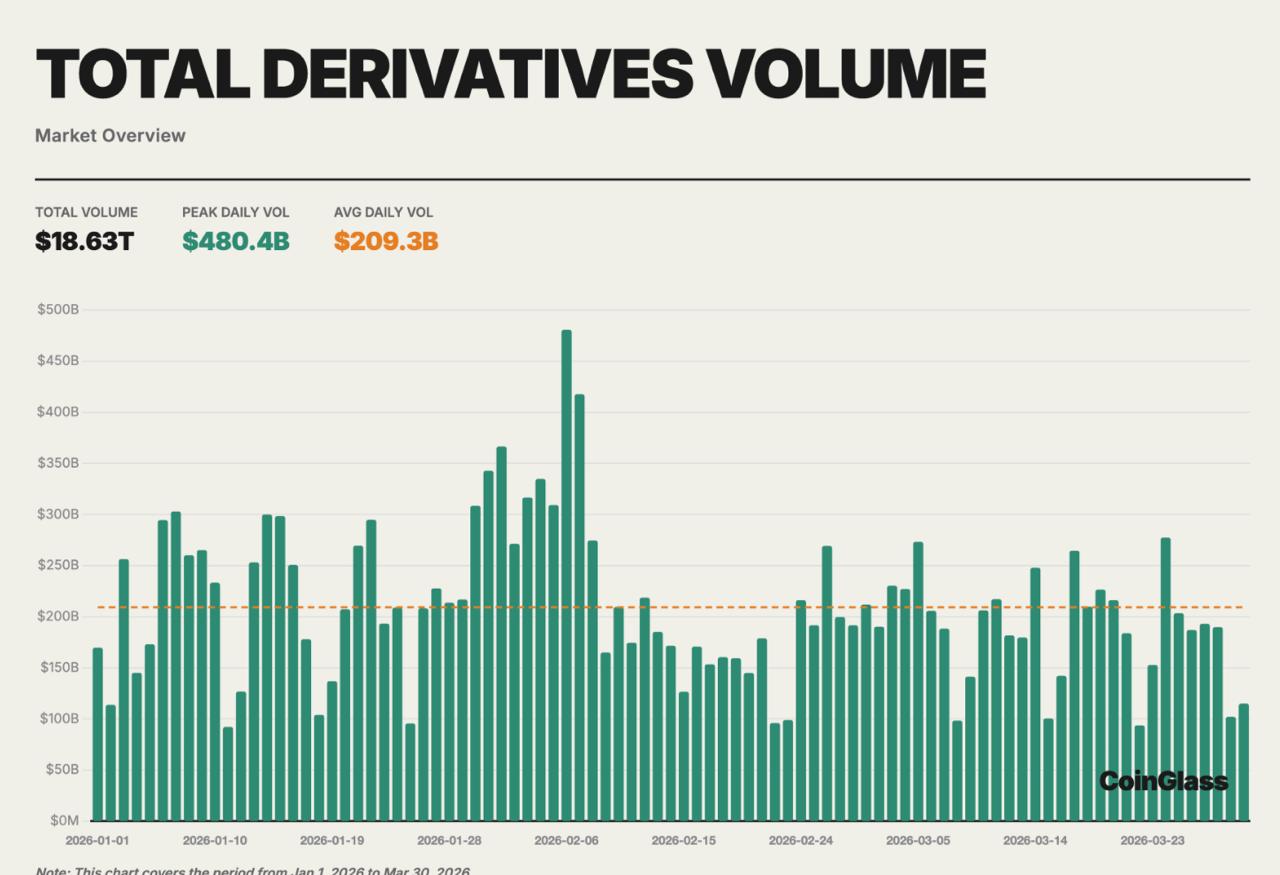
Derivatives trading volume reached approximately $18.63 trillion during Q1 2026, with peak daily derivatives volume reaching around $480 billion and average daily volume of approximately $209 billion. This confirms that leverage, hedging, and short-term positioning continue to dominate crypto market activity.
Looking at the monthly trend, trading activity was highest in January and then gradually declined through February and March. This pattern suggests that the market entered the year with strong activity but then moved into a consolidation or recovery phase after the deleveraging and volatility that occurred in late 2025. During periods of uncertainty, traders typically prefer derivatives for hedging, leverage, and short-term positioning rather than committing capital to long-term spot positions.
Spot Market Competition Remains More Distributed
When looking specifically at spot trading, Binance remained the largest exchange by spot trading volume in Q1 2026 with approximately $639.9 billion in spot trading volume. Gate ranked second with around $201.4 billion, followed by Bybit with $186.9 billion, Coinbase with $167.7 billion, and OKX with $162.7 billion.
The relatively small gap between the second through fifth exchanges shows that competition in the spot market is significantly more distributed than in derivatives markets. This indicates that while Binance clearly leads the spot market, the second tier is more competitive and less concentrated.
Another important trend is that Binance’s spot market share remained stable or slightly increased even as overall spot trading volume declined during the quarter. This suggests that when market activity slows, liquidity tends to concentrate on the largest and most liquid platforms. Traders and institutions often prefer deeper liquidity and better execution, which strengthens the position of leading exchanges during quieter market periods.
Derivatives Market Shows Clear Exchange Hierarchy
The structure of the derivatives market is much more concentrated than the spot market. Binance led derivatives trading volume in Q1 2026 with approximately $4.9 trillion in derivatives trading volume. OKX ranked second with around $2.19 trillion, followed by Bybit with $1.49 trillion and Gate with $1.45 trillion. Bitget completed the top five with approximately $892 billion in derivatives trading volume.
The gap between Binance and the second-largest exchange remains significant, which indicates that Binance’s leadership in derivatives trading is much stronger than its leadership in spot markets. The derivatives market therefore shows a clear hierarchy, with Binance at the top, OKX as the closest competitor, and several exchanges forming a second tier.
Another notable development is the presence of decentralized derivatives platforms such as Hyperliquid among the top exchanges by derivatives activity. Hyperliquid recorded approximately $492.8 billion in derivatives volume during the quarter, highlighting the growing role of on-chain derivatives trading platforms.
Open Interest Shows Where Capital Is Positioned
Trading volume shows activity, but open interest shows where capital is actually positioned in derivatives markets. For this reason, open interest is often considered a more important indicator of market exposure and leverage.
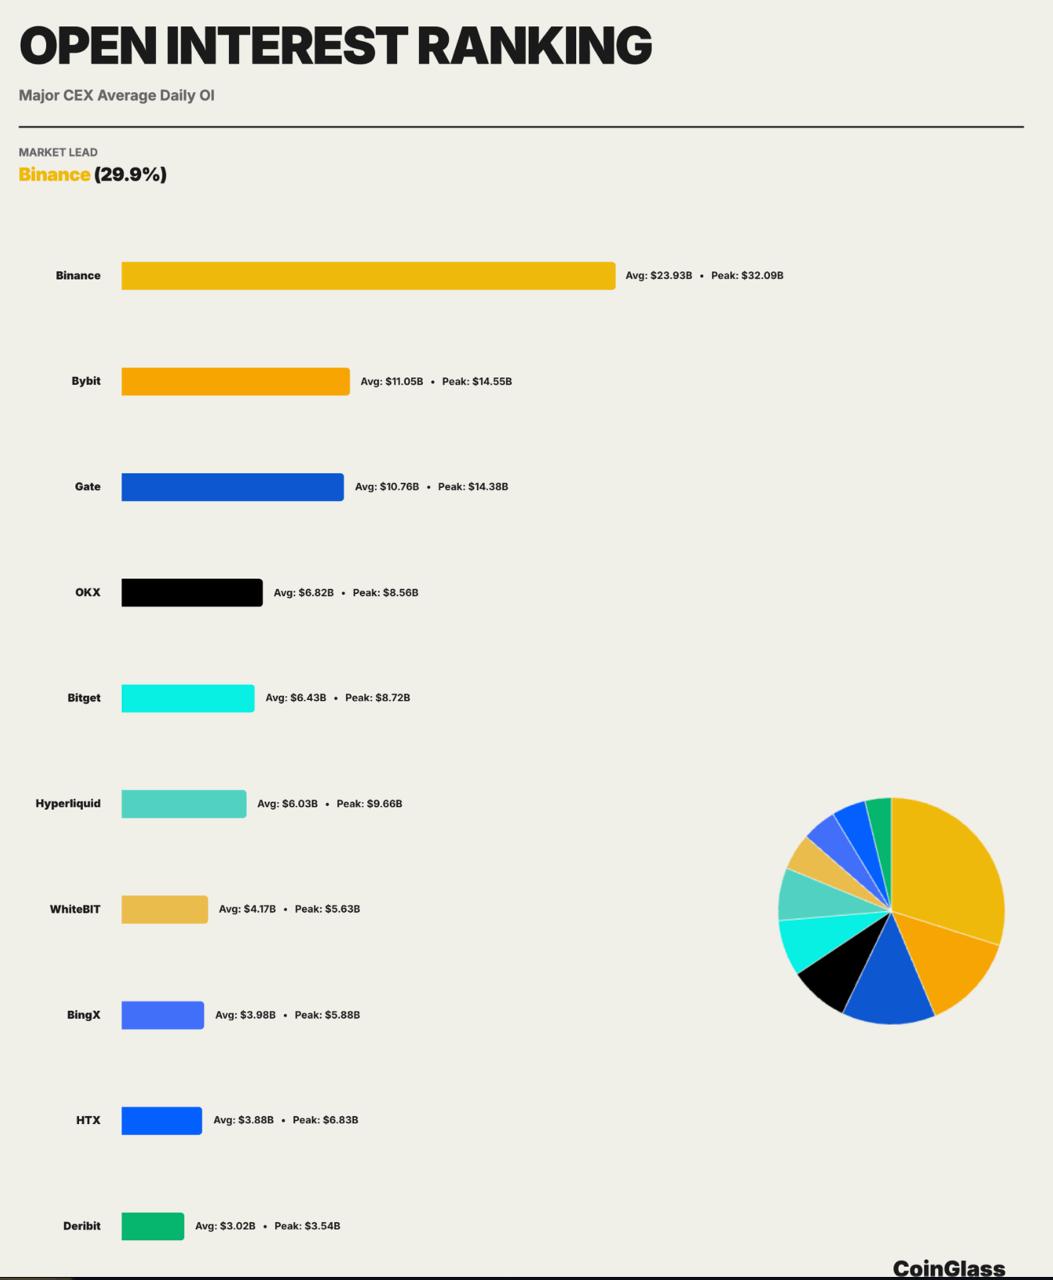
The report shows that Binance ranked first in average open interest during Q1 2026 with approximately $23.9 billion in average open interest. Bybit followed with around $11.0 billion, while Gate held approximately $10.8 billion, and OKX and Bitget held roughly $6–7 billion each. Hyperliquid also ranked among the top platforms with around $6.0 billion in average open interest, further confirming the growing importance of decentralized derivatives platforms.
The quarterly trend also shows that open interest declined significantly from January to February before stabilizing in March. This pattern indicates that traders reduced leverage early in the quarter and then gradually returned to the market, which is consistent with a market recovery phase following a period of volatility and deleveraging.
The Post-Deleveraging “Hangover”
While the Q1 2026 numbers show Binance maintaining roughly a 35% derivatives market share, the real story lies in the psychology of the recovery.
To understand why derivatives volume is currently around 10× larger than spot, we have to look back at the October market crash when Donald Trump announced his 100% tariffs and the large liquidation events that followed. That period fundamentally changed trader behavior.
We are currently seeing three distinct behavioral shifts that the raw data only hints at. First, there has been a flight to the largest and most trusted exchanges, particularly Binance and OKX, as traders prioritize liquidity, insurance funds, and execution reliability. Second, the rise of Hyperliquid reflects a growing interest in on-chain derivatives trading, particularly among traders who prefer transparency and verifiable liquidation mechanisms. Third, much of the derivatives activity appears to be defensive leverage and hedging rather than aggressive directional speculation.
The Q1 2026 market therefore looks less like a new bull market phase and more like a recovery and consolidation period following a major deleveraging event.
User Assets Show Strong Capital Concentration
Perhaps the most important part of the CoinGlass report is the distribution of user asset reserves held on exchanges. This metric reflects where users store their capital and therefore provides insight into platform trust and long-term capital concentration rather than just trading activity.
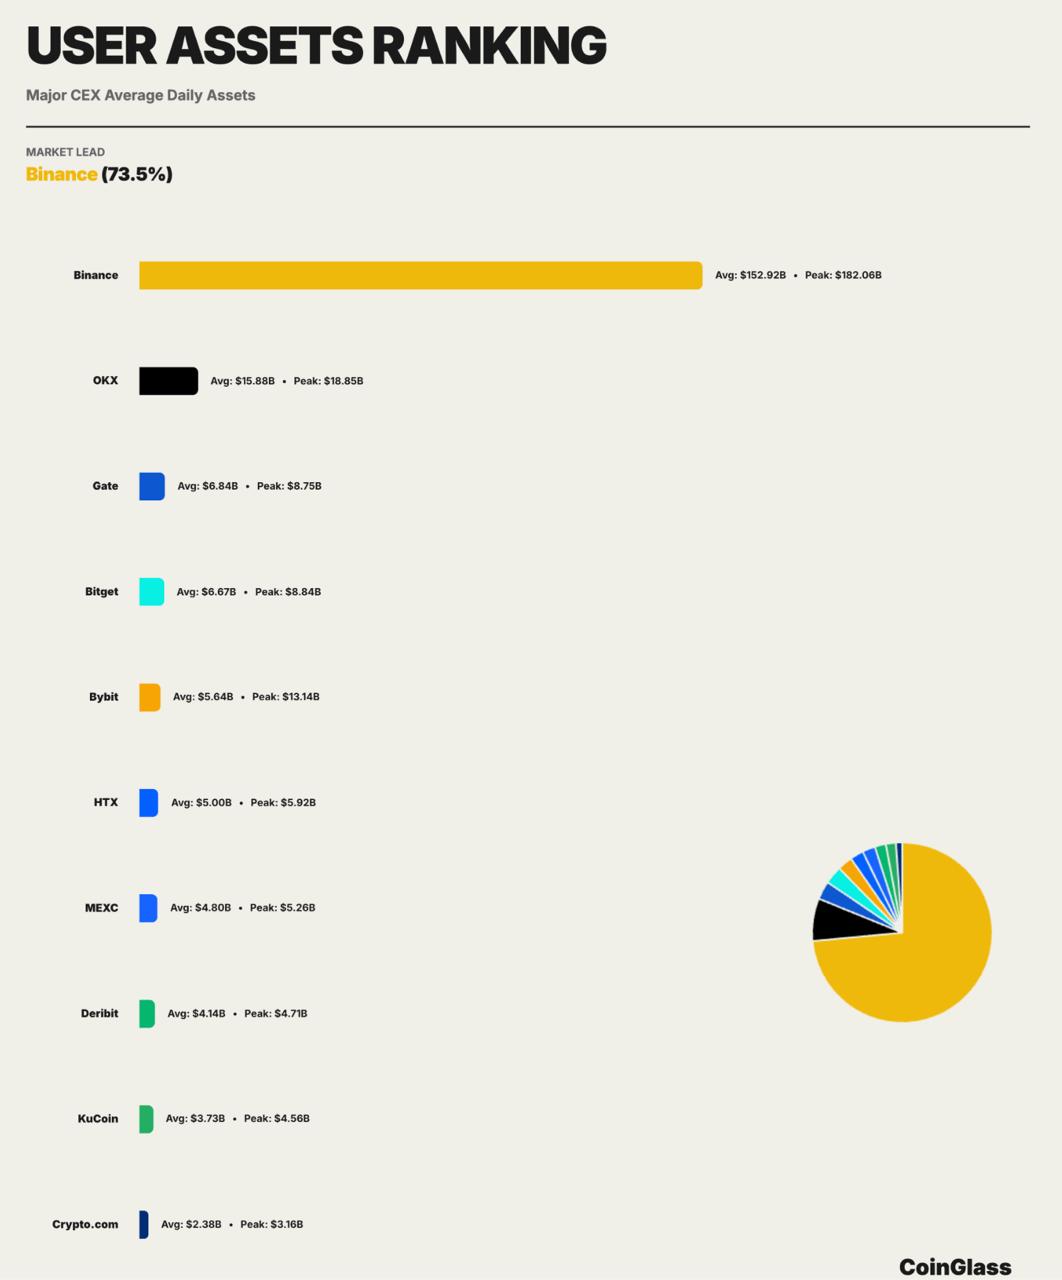
The report shows that Binance held by far the largest share of user assets in Q1 2026, with an average of approximately $152.9 billion in user assets and a peak of $182 billion, representing roughly 73.5% of total assets held across major centralized exchanges.
The second-largest exchange by user assets was OKX with approximately $15.9 billion, followed by Gate with $6.8 billion, Bitget with $6.7 billion, and Bybit with $5.6 billion in average user assets. Other exchanges such as HTX, MEXC, Deribit, KuCoin, and Crypto.com held significantly smaller asset balances, all below $5 billion on average.
This distribution shows that capital concentration in the crypto exchange industry is extremely high. Binance alone holds more user assets than the rest of the major exchanges combined, which highlights how strongly liquidity and capital are concentrated on a single platform.
What This Means for the Crypto Market
When all metrics are analyzed together, trading volume, derivatives activity, open interest, liquidity, and user assets, a clear market structure emerges. The cryptocurrency exchange industry appears highly tiered, with a small number of exchanges dominating liquidity and capital flows.
The data shows that derivatives markets continue to drive most crypto trading activity, which indicates that the market is still heavily driven by leverage, hedging, and short-term trading strategies rather than long-term spot accumulation. This structure is typical during market consolidation or recovery periods rather than during strong bull markets driven by new capital inflows.
At the same time, the rise of decentralized derivatives platforms suggests that the competitive landscape may gradually expand beyond centralized exchanges. While centralized exchanges still dominate trading volume and capital custody, decentralized platforms are beginning to compete in specific segments such as leveraged trading and strategy-based trading.
Overall, the report suggests that the crypto exchange market is becoming more structured, more concentrated, and more institutional in its behavior, with liquidity and capital increasingly concentrated on a small number of major platforms.

Big Picture
The Q1 report provides a comprehensive view of how trading activity, leverage, liquidity, and capital are distributed across the crypto exchange industry. The data shows that while trading volumes declined during the quarter, the overall market structure remained stable, with derivatives markets continuing to dominate activity and liquidity remaining concentrated on the largest exchanges. Binance maintained leadership across all major metrics, including trading volume, open interest, liquidity depth, and user assets, reinforcing its position as a central platform in the global cryptocurrency market.
More broadly, the report suggests that the exchange industry is evolving toward a tiered structure in which a small number of large platforms function as core market infrastructure, while smaller exchanges and decentralized platforms compete in specific niches. As institutional participation grows and derivatives markets remain the primary driver of trading activity, exchange liquidity, capital concentration, and execution quality will likely become increasingly important factors shaping the future structure of the cryptocurrency market.
What to Watch Next
Risk Factors
Despite the relatively stable exchange rankings in Q1, several structural risks remain in the current market environment. The dominance of derivatives trading means that leverage continues to play a large role in price movements, which increases liquidation risk during periods of volatility. At the same time, the high concentration of liquidity and user assets on a small number of exchanges creates a form of systemic risk, where operational, regulatory, or liquidity issues at a major exchange could have a disproportionate impact on the broader market.
Regulatory pressure is another important variable. If major exchanges face regulatory restrictions in key jurisdictions, trading activity and capital could shift quickly to other platforms. This could reshape market share distribution much faster than organic competition would.
Finally, the growing role of decentralized derivatives platforms introduces a new competitive dynamic. While still smaller than centralized exchanges, on-chain trading venues are attracting a specific segment of traders, particularly those focused on leverage and strategy-based trading.
What to Watch Next: The Road Through 2026
While the Q1 data confirms a period of consolidation and tiered concentration, several pivot points will determine if this hierarchy holds through the remainder of the year.
Spot-to-Derivatives Ratio:
Will we see a shift back to spot buying, signaling a true bull market?
DEX Penetration:
Does Hyperliquid maintain its top-5 status as more retail moves on-chain?
Concentration Risk:
Does Binance’s asset lead continue to grow, or does regulatory pressure lead to a redistribution among tier-2 exchanges?
These indicators will likely determine whether the crypto market becomes more decentralized and competitive, or more concentrated around a small number of dominant trading platforms.
The information provided in this article is for educational purposes only and does not constitute financial, investment, or trading advice. Coindoo.com does not endorse or recommend any specific investment strategy or cryptocurrency. Always conduct your own research and consult with a licensed financial advisor before making any investment decisions.

Kosta joined the team in 2021 and quickly established himself with his thirst for knowledge, incredible dedication, and analytical thinking. He not only covers a wide range of current topics, but also writes excellent reviews, PR articles, and educational materials. His articles are also quoted by other news agencies.