Bullish Bets Return to Ethereum As Price Gains 9% for The Week
The Ethereum derivatives market is flashing a fascinating divergence: trader conviction is recovering much faster than the underlying spot price.
Following a sharp flush out in early June, leverage is quietly returning to the market. However, unlike previous speculative peaks, this rebuilding phase is characterized by localized aggressive positioning rather than market-wide exhaustion.
Key Takeaways
- ETH funding rates hit 0.016% despite lower prices.
- Total open interest sits at $4.35B, avoiding overheating.
- Bullish conviction rebuilds with ETH 15-20% below peaks.
Conviction Leading Price
The first clear signal of returning bullish sentiment shows up in funding rates, the periodic fee paid between long and short traders to keep perpetual contract prices pegged to the spot index.
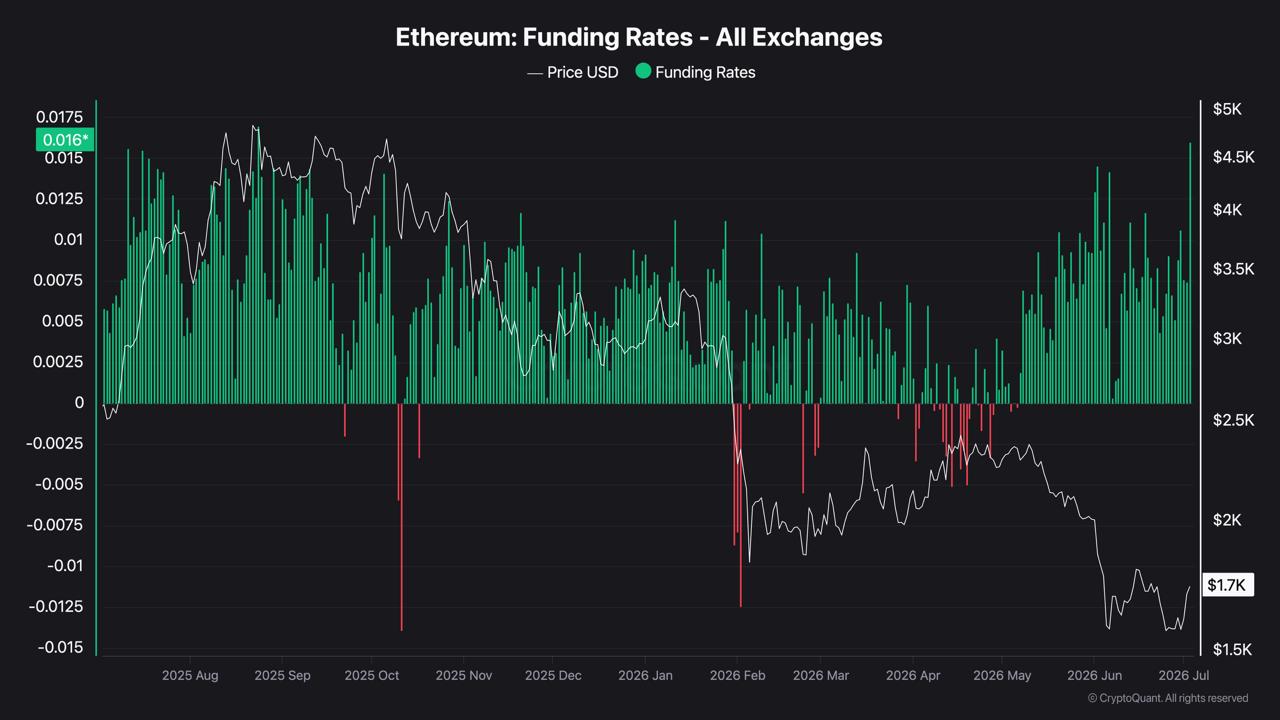
Currently, funding rates across major exchanges have accelerated back to approximately 0.016%. To put this in perspective, this is significantly higher than the 0.009% levels observed in late May, even though Ethereum was trading much higher at the time ($2,000–$2,150).
Late May Pre-Washout vs. Current Stabilization
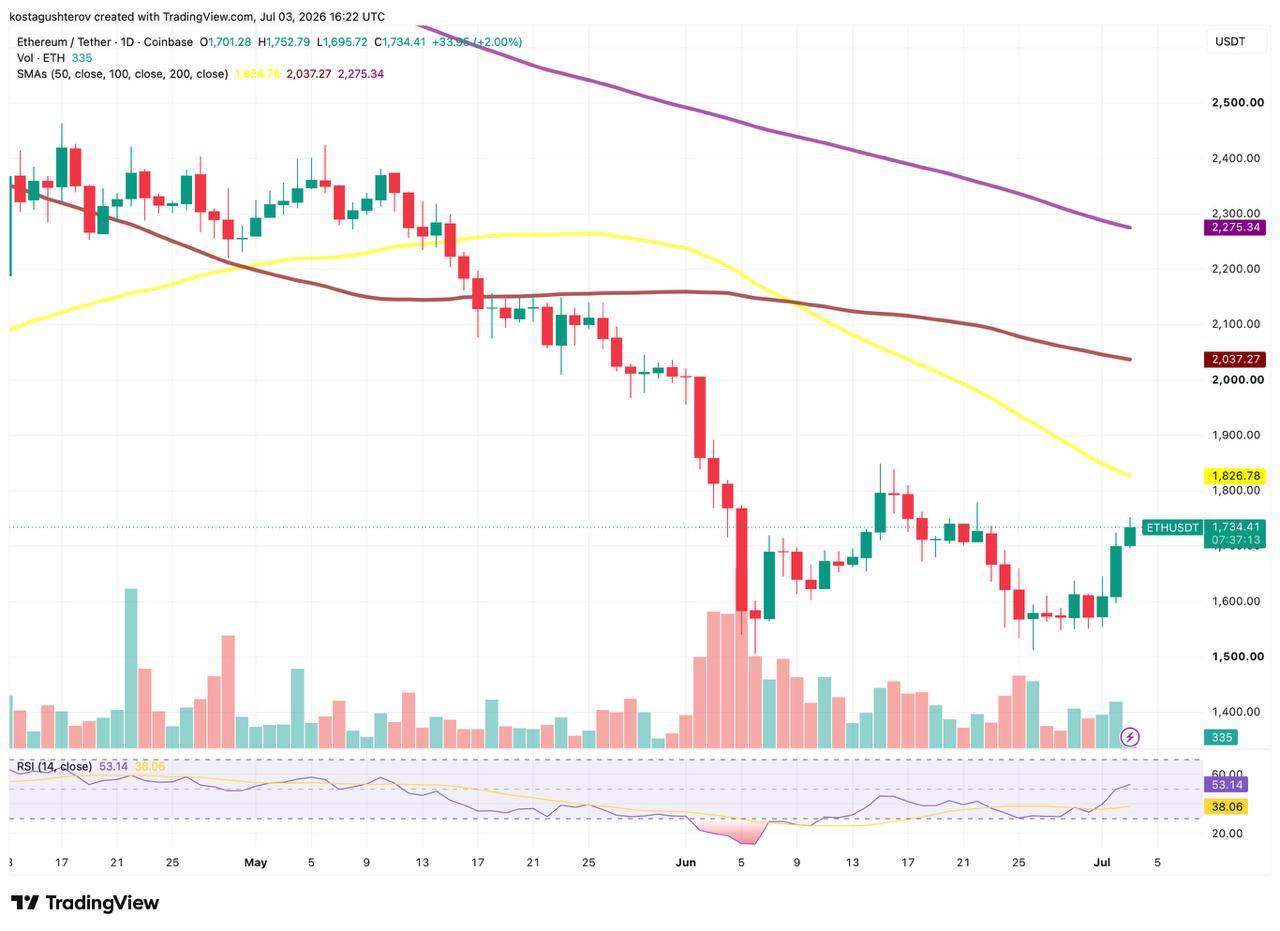
- ETH Spot Price: $2,000 – $2,150 in late May vs. $1,730 at the time of writing.
- Average Funding Rate: ~0.009% in late May vs. ~0.016% currently.
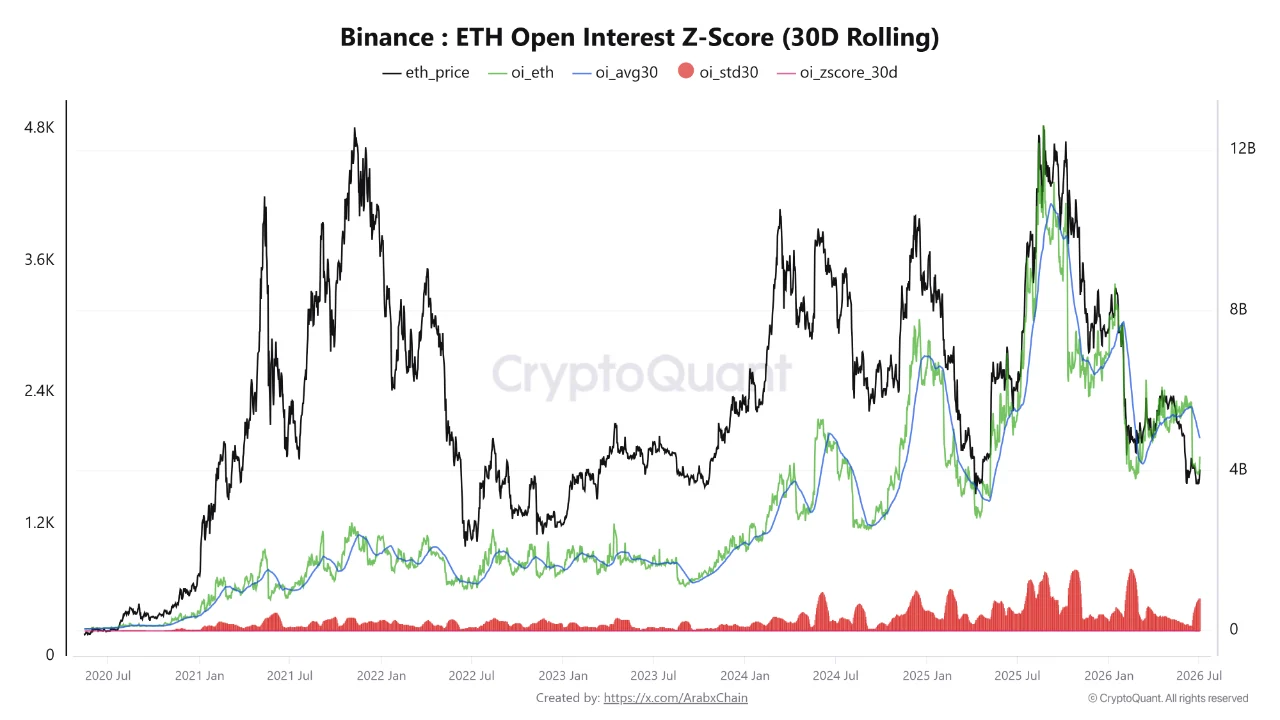
- Total Open Interest: High peak over $12B in late May vs. ~$4.35B (below the 30-day average) currently.
When ETH fell to its early June floor near $1,540, a massive wave of leveraged long positions was wiped clean from the order books, temporarily cooling the market. Crucially, funding rates refused to stay negative for any meaningful duration. Short sellers never took dominant control. Instead, as spot prices consolidated and stabilized around the $1,700–$1,730 liquidity pocket after 9% gain for the week according to CoinMarketCap data, buyers aggressively stepped back in, driving the cost of holding leverage to its highest point in weeks.
The Structural Volatility Shield
While funding rates show that active traders are increasingly eager to bet on upside, the second dataset proves that the broader market is not yet dangerously over-leveraged.
Binance’s 30-day Open Interest (OI) Z-Score, which measures how far current leverage volume deviates from its statistical average, currently sits at -0.56, according to report, shared by CryptoQuant. Total open interest across the market is hovering around $4.35 billion, remaining comfortably below the 30-day baseline of $4.81 billion.
What this tells us is that while individual participants are using higher leverage (high funding), the total volume of leveraged positions in the system is still entirely manageable. The speculative excesses of early cycle shifts might be successfully digested.
This localized positioning marks a pivotal shift from the retail-led euphoria that defined the 2025 cycle peaks. In previous rallies, market-wide leverage was often driven by speculative cascades, where retail over-leveraging forced rapid, correlated liquidations. Conversely, the current fragmentation suggests that institutional allocators are re-entering with a more surgical approach.
Data from SoSoValue reinforces this thesis, showing a clear, consecutive ramp in Ethereum Spot ETF inflows, climbing from $14.89M on July 1 to $29.08M by July 2. This reversal follows a grueling nine-day streak of consecutive net outflows, underscores a deliberate, capital-intensive accumulation phase.
For these desks, a non-correlated recovery is actually a health signal; it indicates that the market is currently supported by structural demand rather than reactive, emotion-driven sentiment. By avoiding a broad, systemic blow-up, the market is constructing a more durable floor. This layout makes the current environment significantly more attractive for institutional mandates that prioritize structural stability over parabolic, high-risk exposure.

Will Spot Follow Derivatives?
This structural layout sets up a high-stakes race between derivatives conviction and spot market demand.
Positive funding rates are fundamentally healthy during sustained uptrends; they signal an appetite for risk and structural momentum. The underlying risk surfaces when derivatives positioning outpaces spot market accumulation.
If Ethereum’s spot demand strengthens and absorbs this momentum, the rising funding rates could serve as fuel for a clean, sustainable recovery. However, if spot buying fails to break key overhead resistance levels, these newly minted, high-funding long positions will become exposed. A failure to move higher could transform this growing optimism into a localized liquidation trap, prompting short-term cascade liquidations and heightened volatility.
The early June washout effectively cleared the board, but it did not break the underlying risk-on bias of the market. With traders front-running a recovery while ETH still sits 15-20% below its spring highs, all eyes now turn to spot order books to validate the move.

Alex is Editor-in-Chief of Coindoo and co-founder of Millennial Media Group, with nearly a decade of experience covering financial markets - crypto first, then everything else. It started in 2016 with Bitcoin. Like most people at the time, he didn't fully understand it - so he kept digging. Blockchain, tokenomics, the projects, the cycles. That curiosity never stopped, and eventually pulled him into traditional markets too: equities, commodities, macro. Not because he left crypto behind, but because you can't properly understand one without the other. What drives him is straightforward: he wants to know why something is happening, not just that it's happening. Most market coverage stops at the headline - price up, price down, here's a chart. Alex finds that kind of reporting actively unhelpful. If you walk away from an article without understanding the mechanism behind the move, what did you actually learn? He holds a degree in Tourism from New Bulgarian University - not the most obvious path into financial markets, but markets have a way of pulling in people who are simply too curious to stay out. He has authored over 200 in-depth analyses and more than 10,000 articles across crypto and traditional finance. He still thinks every day in markets teaches him something new. That's probably why he hasn't stopped.