Bitcoin Weekly Chart: Can Spot Buyers Clear $79,600 and $82,800?

Bitcoin trades near $78,500, below its 50-week SMA at $79,600 and May resistance near $82,800. Spot participation will determine whether the recovery can clear both barriers.
Key Takeaways
Bitcoin faces two separate weekly barriers
The first obstacle on the Bitstamp BTC/USD weekly chart is the falling 50-week simple moving average near $79,600. Bitcoin was approximately $1,100 below that level when the chart was captured, putting the average about 1.4% above the market price.
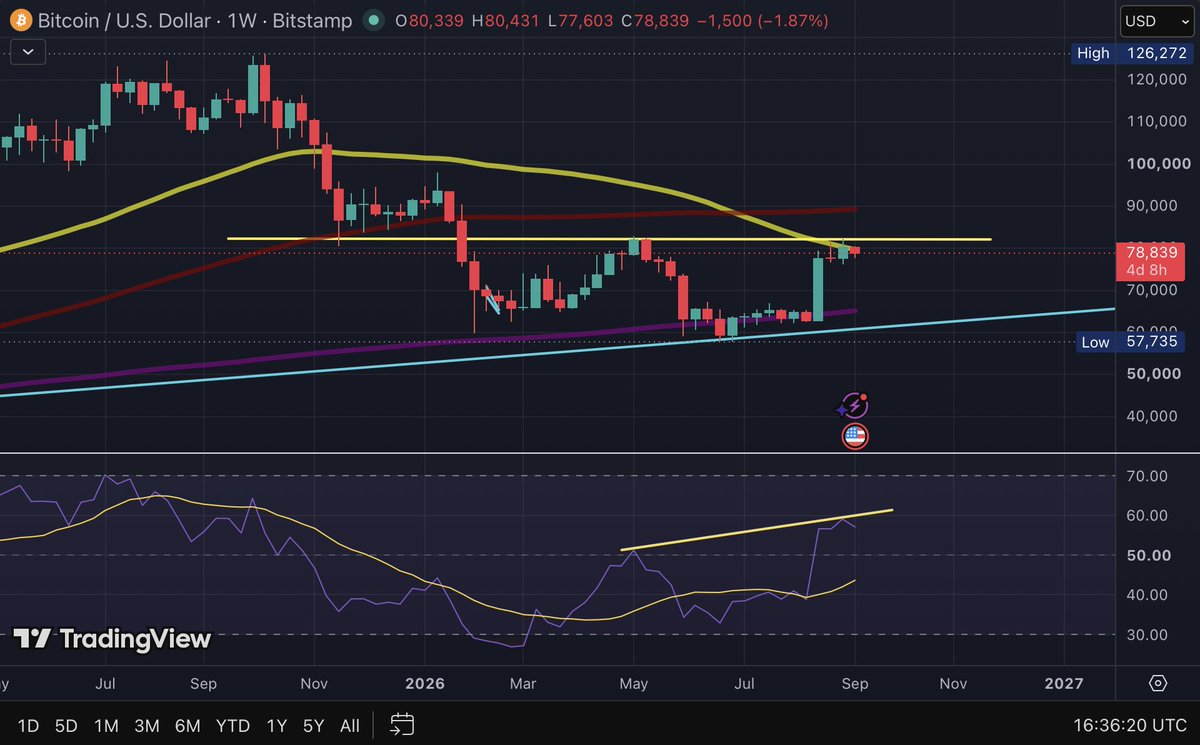
A weekly close above the average would return Bitcoin above an important long-term trend measure. It would not complete the larger breakout because the resistance that stopped the May recovery remains higher.
That second barrier extends from approximately $82,000 to $82,800 and includes the May high near $82,790. A move through the 50-week SMA would therefore improve the chart, but Bitcoin would still need to overcome the previous high before the recovery could enter a stronger phase.
RSI shows stronger momentum than in May
Weekly RSI is in the upper 50s, compared with roughly 50-52 during the May resistance test. Bitcoin is approaching the same broad price area with a higher momentum reading than it had during the earlier recovery.
The comparison is not a textbook bullish divergence. Conventional bullish divergence normally requires price to form a lower low as RSI produces a higher low. Bitcoin is instead returning toward an earlier resistance area with stronger relative momentum.
RSI also remains below 70, though that does not provide a separate buy signal or guarantee additional upside. Its value here comes from comparing the strength of the two approaches to resistance.
The current weekly candle had more than four days remaining when the chart was captured. Both price and RSI could change before the close, so the unfinished readings should not be treated as confirmation.
RSI also cannot show whether the recovery is being driven by direct Bitcoin purchases or leveraged contracts. That distinction requires a closer look at spot and derivatives activity.
Futures activity still dwarfs spot volume
CoinGlass showed approximately $61.6 billion in 24-hour Bitcoin futures volume, compared with about $4 billion in spot volume. Futures turnover was therefore around 15.4 times larger than reported spot activity at that reading.
The difference shows that derivatives account for most of the measured trading turnover. It does not reveal whether those traders are positioned for higher or lower prices because every futures transaction has both a buyer and a seller.
Bitcoin open interest stood near $53.2 billion. That figure represents outstanding derivatives exposure, but it does not establish whether leverage has recently increased without a comparison over time.
Taken together, the figures show that Bitcoin’s recovery is unfolding in a market dominated by derivatives turnover, with substantial open positions but limited evidence that spot demand is strengthening at the same pace. That does not make the advance unsustainable, though it leaves the breakout more exposed to a reversal if leveraged traders withdraw. Rising spot volume during a move above $79,600 and $82,800 would provide clearer evidence that direct buying is supporting the stronger weekly momentum.
ETF demand faces a follow-through test
U.S. spot Bitcoin ETFs recorded approximately $1.01 billion in net inflows across the three trading sessions from September 2 through September 4. The strongest session came on September 3, when the funds attracted about $730.9 million.
That session accounted for nearly 73% of the three-day total, showing that the inflows were heavily concentrated on one day. The sequence then reversed, with an estimated net outflow of $46.7 million on September 8, according to SoSoValue.
The outflow does not erase the earlier demand, but it interrupts the positive sequence before Bitcoin has cleared either weekly barrier. Renewed inflows during a breakout would show that U.S. spot ETFs are supporting the move. Continued outflows would leave the breakout with less confirmation from that source of demand.

The weekly closes that decide the setup
1. First test: the 50-week SMA at $79,600
The first positive signal would be a completed weekly close above $79,600. An intraperiod move through the average would not carry the same weight because Bitcoin could fall back below it before the candle closes.
Holding above the average during the following sessions would allow Bitcoin to challenge the May resistance. A close above $79,600 followed by immediate weakness would leave the first breakout attempt unresolved.
2. Second test: the $82,000-$82,800 resistance
A weekly close above $82,800 would clear both the May high and the 50-week SMA. Continued trading above the area during the following week would provide stronger confirmation that the previous resistance had become support.
The breakout would be more convincing if spot volume increased and ETF inflows resumed. Those conditions would not guarantee further gains, but they would show that the move had support beyond derivatives trading.
3. Failed resistance test
A rejection followed by a weekly close below approximately $77,600 would weaken the recovery and show that buyers could not hold the current range. The $75,700-$76,000 area would then become the next important support.
A deeper decline would bring the midpoint of the recent advance near $71,800 into view. The $64,000-$66,000 region around the 200-week SMA would become relevant only after substantially greater weakness. Short intraday moves should not be used to confirm those weekly downside scenarios.
Spot buyers have not cleared either barrier
Bitcoin’s higher RSI could be making this approach more promising than the May test, but price remains below the 50-week SMA and the previous high. Current volume data also shows that derivatives dominate trading, while the latest completed ETF session ended with an outflow.
The bullish case requires a weekly close above both resistance levels, supported by firmer spot activity and renewed ETF demand. Until that happens, stronger momentum represents an improvement rather than confirmation of a durable breakout.
This article is for informational purposes only and does not constitute financial advice.



Kosta has reported on cryptocurrency markets and blockchain infrastructure since 2020, bringing over six years of hands-on experience in the crypto industry built through daily tracking of markets, trends, and emerging blockchain developments. Specializing in Bitcoin on-chain analysis, institutional ETF flows, and digital asset price action, his work at Coindoo has been cited by other news agencies and consistently covers market developments with a focus on data-driven reporting across Bitcoin, Ethereum, Solana, and XRP. Over the years, Kosta has contributed to multiple crypto media outlets in different regions, authoring over 6,000 articles across the sector. His reporting spans cryptocurrency markets and the broader fintech industry, tracking not only price action but also the technological and regulatory forces shaping the ecosystem. To support his analysis, Kosta actively leverages on-chain data and metrics from leading platforms such as Santiment, Glassnode, and CryptoQuant, enabling deeper, evidence-based market insights. He believes in the power of transparency and the data that underpins the blockchain ecosystem. His academic background in Marketing Management from Denmark further complements his analytical approach, adding a strong understanding of communication strategy and content positioning to his work.