Bitcoin Rejected Again – Is $58,000 the Next Stop?

Bitcoin trades near $62,700 at the time of writing after buyers failed to recover the resistance formed by the 50-day simple moving average near $63,280 and the 0.236 Fibonacci retracement around $63,600.
Price approached the area but did not establish a daily close above either level. Bitcoin also remains inside the descending channel that has produced lower highs since July 21.
The $63,300-$63,600 Area Remains Unrecovered
The proximity of the 50-day SMA and the Fibonacci retracement creates one resistance band rather than two isolated levels.
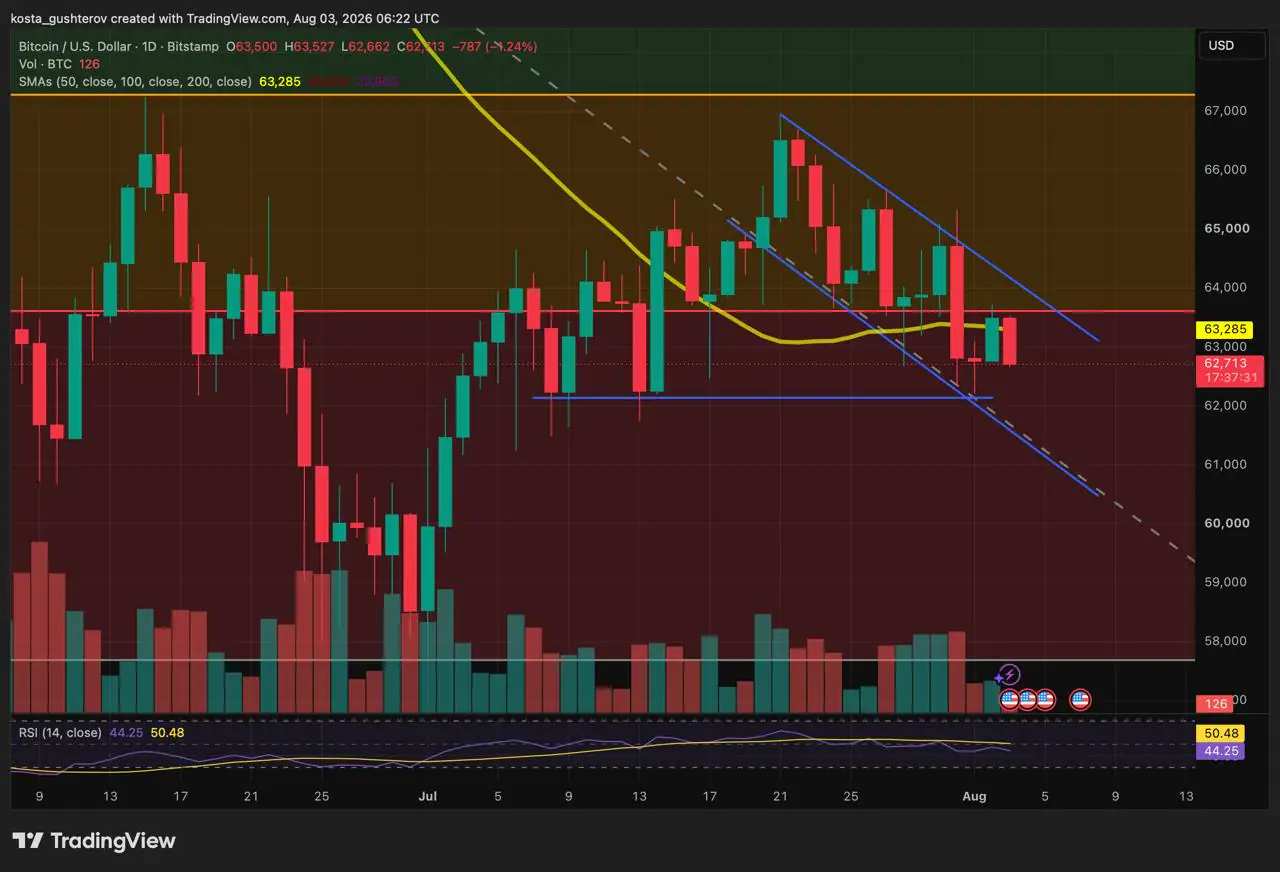
Bitcoin previously traded above this area before losing it during the latest correction. Recovering only the lower edge would leave the Fibonacci level and the descending channel overhead.
A daily close above the full range would repair part of the recent technical damage. The upper channel boundary would still need to break and hold after successful retest before the sequence of lower highs ended.
$62,100 Is the Nearest Support
Horizontal support sits near $62,100, close to the lower portion of the descending channel. The area has already stopped several declines during the current correction.
A daily close below $62,100 would remove the nearest horizontal floor and place the channel boundary under pressure. If both levels fail, the chart shows limited established support before the broader area around $58,000.
That zone stopped the late-June decline, although its previous reaction does not guarantee that buyers would defend it again.
Short-Term Holders Moved 32,000 BTC at a Loss
The latest weakness coincided with a large increase in exchange deposits from recent Bitcoin buyers.
CryptoQuant analyst Darkfost posted on X that short-term holders sent more than 32,000 BTC to exchanges at a loss on August 1. It was one of the largest such movements recorded during the previous 30 days.
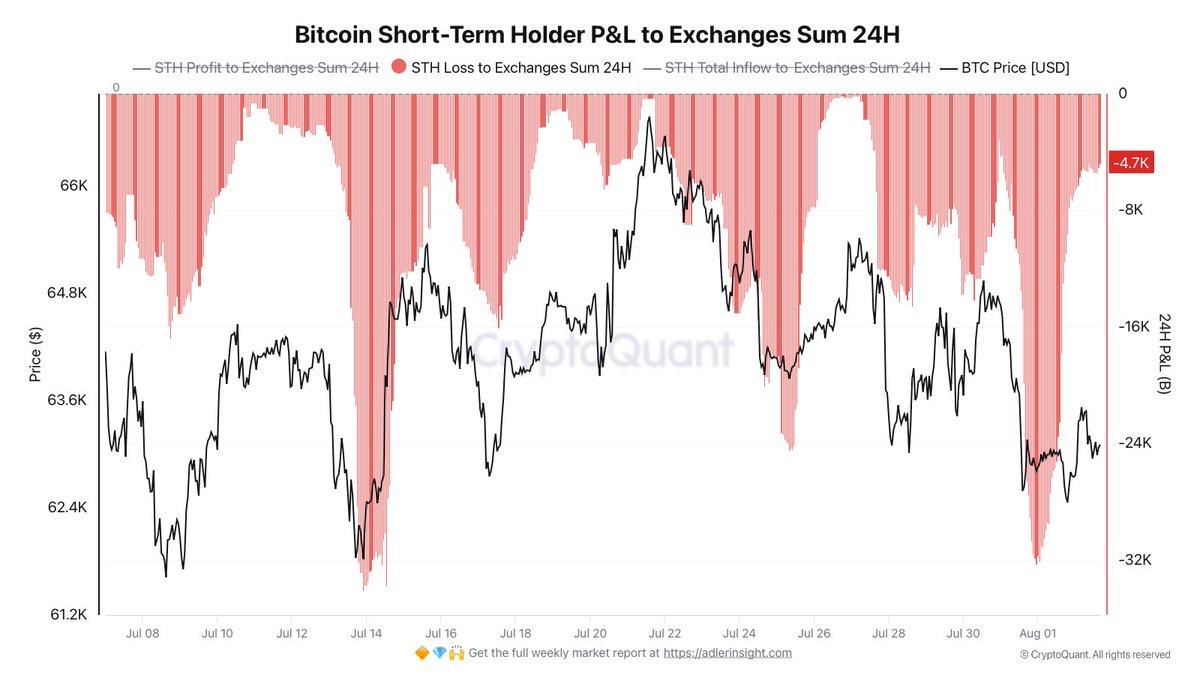
Short-term holders generally bought their coins more recently than long-term investors. Moving Bitcoin to an exchange below its acquisition price shows that some of those positions were under pressure.
An exchange deposit does not confirm that every coin was sold. It does place the Bitcoin where it can be traded more easily, increasing the amount of available supply while price is already struggling below resistance.
The inflow occurred close to Bitcoin’s failed recovery near $63,600. The timing does not prove that short-term holders caused the rejection, but it shows that recent buyers were moving underwater positions toward trading venues during the same period.

The Inflow Does Not Confirm a Market Bottom
Large loss-related deposits can appear during capitulation, but the movement alone does not show that selling has finished.
The coins may remain on exchanges, be sold to other short-term traders or continue circulating between speculative accounts. The data also does not identify who absorbed any Bitcoin that changed hands.
A more constructive development would require the loss-related inflows to slow while price stabilizes and spot demand absorbs the available supply. Until then, the 32,000 BTC movement remains evidence of stress among recent buyers rather than confirmation that the correction has reached its end.
Bitcoin remains inside the descending channel, with $62,100 protecting the downside and the former support band overhead. A daily close outside those boundaries would provide more information than another intraday move within them.
- Disclaimer: This article is for informational purposes only and does not constitute financial or investment advice. Technical levels and onchain movements do not guarantee future price performance.
- Methodology: The analysis uses the BTC/USD daily Bitstamp chart dated August 3, 2026, including the 50-day SMA, 0.236 Fibonacci retracement, horizontal support and descending channel. Short-term holder data comes from CryptoQuant analyst Darkfost’s August 3 analysis of Bitcoin sent to exchanges at a loss.



Alex is Editor-in-Chief of Coindoo and co-founder of Millennial Media Group, with nearly a decade of experience covering financial markets - crypto first, then everything else. It started in 2016 with Bitcoin. Like most people at the time, he didn't fully understand it - so he kept digging. Blockchain, tokenomics, the projects, the cycles. That curiosity never stopped, and eventually pulled him into traditional markets too: equities, commodities, macro. Not because he left crypto behind, but because you can't properly understand one without the other. What drives him is straightforward: he wants to know why something is happening, not just that it's happening. Most market coverage stops at the headline - price up, price down, here's a chart. Alex finds that kind of reporting actively unhelpful. If you walk away from an article without understanding the mechanism behind the move, what did you actually learn? He holds a degree in Tourism from New Bulgarian University - not the most obvious path into financial markets, but markets have a way of pulling in people who are simply too curious to stay out. He has authored over 200 in-depth analyses and more than 10,000 articles across crypto and traditional finance. He still thinks every day in markets teaches him something new. That's probably why he hasn't stopped.