Bitcoin Pumps 12% in a Day: What the Chart Shows Next

Bitcoin rose 12.3% in past 24h to trade near $71,720 on Bitstamp on August 20, climbing above $70,000 and crossing its 50-, 100- and 200-day simple moving averages.
Key Takeaways
- $70,250 is the first level below price.
- The 200-day SMA sits at $68,970.
- $73,200 is the nearest resistance level.
- Liquidated shorts amplified the day’s price rise.
- Bitcoin ETFs recorded $517.19 million in inflows.
$70,250 is now the level Bitcoin needs to keep
The chart measures Bitcoin’s recovery from the June low near $57,700 toward the May high of $82,800. Fibonacci retracements divide that decline into proportions that traders watch when judging whether a rebound is developing into a broader recovery.
Bitcoin has reclaimed the halfway point at $70,250. That matters more than the round $70,000 mark because it is the level that separates the lower and upper halves of the May-to-June decline. Holding it on a retest would show that buyers are prepared to support the move after the initial breakout.
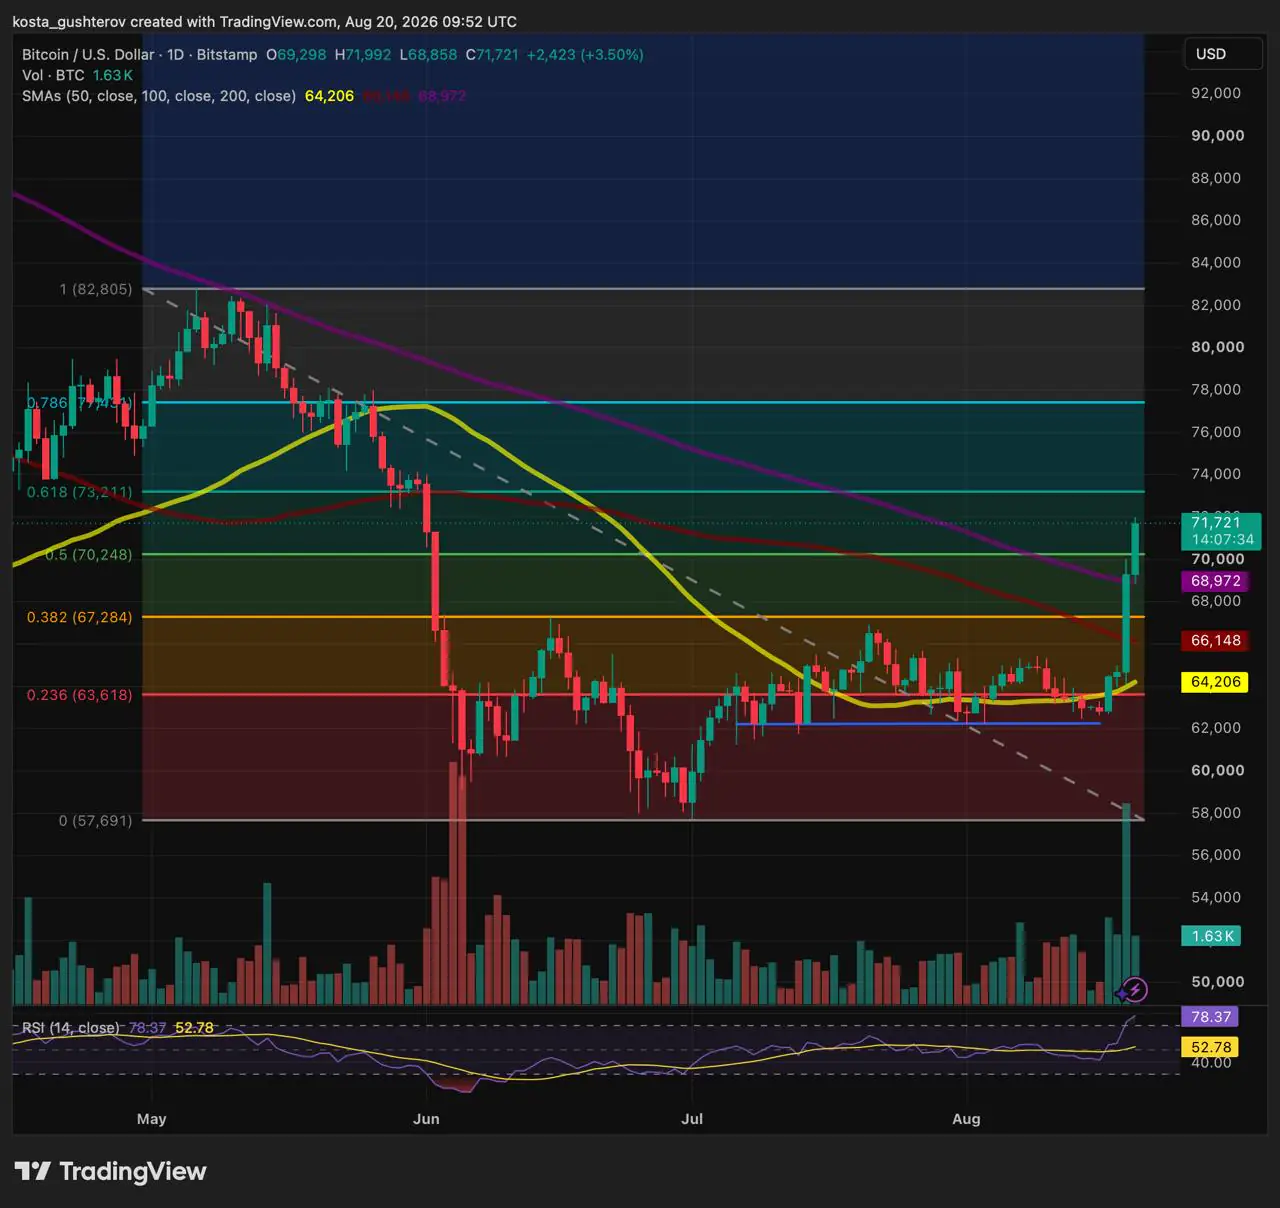
The next retracement sits at $73,200. Bitcoin stalled around that area in late May, so it is the first level where the rally meets prior supply. Above it, the 0.786 retracement near $77,400 is the next resistance within the chart’s immediate range.
Bitcoin crossed three averages, but they are not yet aligned
Bitcoin did not merely break $70,000. It moved above three averages that had been overhead during the recent decline: the 50-day SMA at $64,200, the 100-day SMA at $66,150 and the 200-day SMA at $68,970.
Each line shows the market’s average closing price over a different period. The 50-day average is more sensitive to recent trading, while the 200-day line changes slowly and is widely used to judge whether an asset is trading above or below its longer-term trend.
The order of these averages still carries the mark of the earlier sell-off: the 50-day line remains below the 100-day and 200-day lines. Reclaiming all three is a strong short-term repair, but a full trend reversal would require Bitcoin to remain above them long enough for the averages themselves to turn higher.
The 200-day SMA at $68,970 is the most important of the three on a pullback. Below it, the 0.382 Fibonacci level at $67,280 and the 100-day SMA at $66,150 form the remaining nearby support area.
The rally had a short-covering tailwind
The move unfolded during the wider short-liquidation wave examined in Crypto’s 8th-Biggest Liquidation Event.
Liquidated shorts are not fresh bullish bets. When a short position reaches its liquidation level, the exchange closes it through buy orders in the derivatives market. Those orders can push price higher quickly once resistance breaks, especially after a quiet trading range has encouraged traders to position against a move.
The speed of Bitcoin’s advance therefore says less than its behaviour after the forced buying fades. A return to $70,250 will show whether buyers are willing to hold the level without help from short covering.
The ETF inflow came through spot funds, not leverage
U.S. spot Bitcoin ETFs recorded a combined $517.19 million in net inflows on August 19, according to SoSoValue. The supplied history data showed the largest daily inflow since May 4.
That flow is separate from the derivatives squeeze. ETF figures are reported after the U.S. trading session and do not show the precise moment Bitcoin was bought. They do show that demand was not confined to traders closing leveraged short positions: capital also moved into regulated spot-fund products.
| Price behaviour | What it would indicate |
|---|---|
| Bitcoin holds above $70,250 | The 0.5 Fibonacci level is acting as support after the breakout. |
| Bitcoin loses $68,970 | The daily 200-day SMA has failed to hold; $67,280 and $66,150 become the next supports. |
| Bitcoin closes above $73,210 | The 0.618 retracement has been reclaimed, leaving $77,430 as the next nearby resistance. |
Bitcoin has recovered the midpoint of its May-to-June decline. The next test is simple: preserve $70,250 on a retest, then break $73,200 before the market can challenge the $77,400 retracement.
Source review: Technical levels are based on the Bitstamp BTC/USD daily TradingView chart captured at 09:52 UTC on August 20, 2026. ETF flow data is from the supplied SoSoValue history table, which showed $517.19 million in net inflows on August 19 and the largest daily inflow since May 4. Liquidation context is based on Coindoo’s earlier coverage of CoinGlass data. The article is provided for informational purposes only and does not constitute investment advice.



Kosta has reported on cryptocurrency markets and blockchain infrastructure since 2020, bringing over six years of hands-on experience in the crypto industry built through daily tracking of markets, trends, and emerging blockchain developments. Specializing in Bitcoin on-chain analysis, institutional ETF flows, and digital asset price action, his work at Coindoo has been cited by other news agencies and consistently covers market developments with a focus on data-driven reporting across Bitcoin, Ethereum, Solana, and XRP. Over the years, Kosta has contributed to multiple crypto media outlets in different regions, authoring over 6,000 articles across the sector. His reporting spans cryptocurrency markets and the broader fintech industry, tracking not only price action but also the technological and regulatory forces shaping the ecosystem. To support his analysis, Kosta actively leverages on-chain data and metrics from leading platforms such as Santiment, Glassnode, and CryptoQuant, enabling deeper, evidence-based market insights. He believes in the power of transparency and the data that underpins the blockchain ecosystem. His academic background in Marketing Management from Denmark further complements his analytical approach, adding a strong understanding of communication strategy and content positioning to his work.