Bitcoin Price Stays Quiet Below $80K as Losses Pile Up

Bitcoin is drifting below $80,000 in some of the quietest trading since 2021, yet recent buyers are moving coins to Binance at a loss almost as heavily as in July.
Key Takeaways
- 9,990 BTC hit Binance from underwater recent buyers
- Volatility near its lowest levels since 2021
- Options price a roughly $1,800 Fed-window move
- $76,000 support band is the next test
BTC traded at $79,910 at 11:59 UTC on October 27, down 0.30% on the day, according to the Binance BTC/USDT daily chart. The session ranged from $79,506 to $80,388, extending Bitcoin’s test of $80,000 ahead of the Fed.
Recent buyers are selling at July-level losses
Short-term holders, wallets that bought within roughly the last five months, have been sending coins to Binance while underwater. In a report on CryptoQuant, analyst Amr Taha said his measure of those loss-making transfers reached −9,990 BTC on October 26. The minus sign marks coins moved at a loss; it does not mean coins left the exchange.
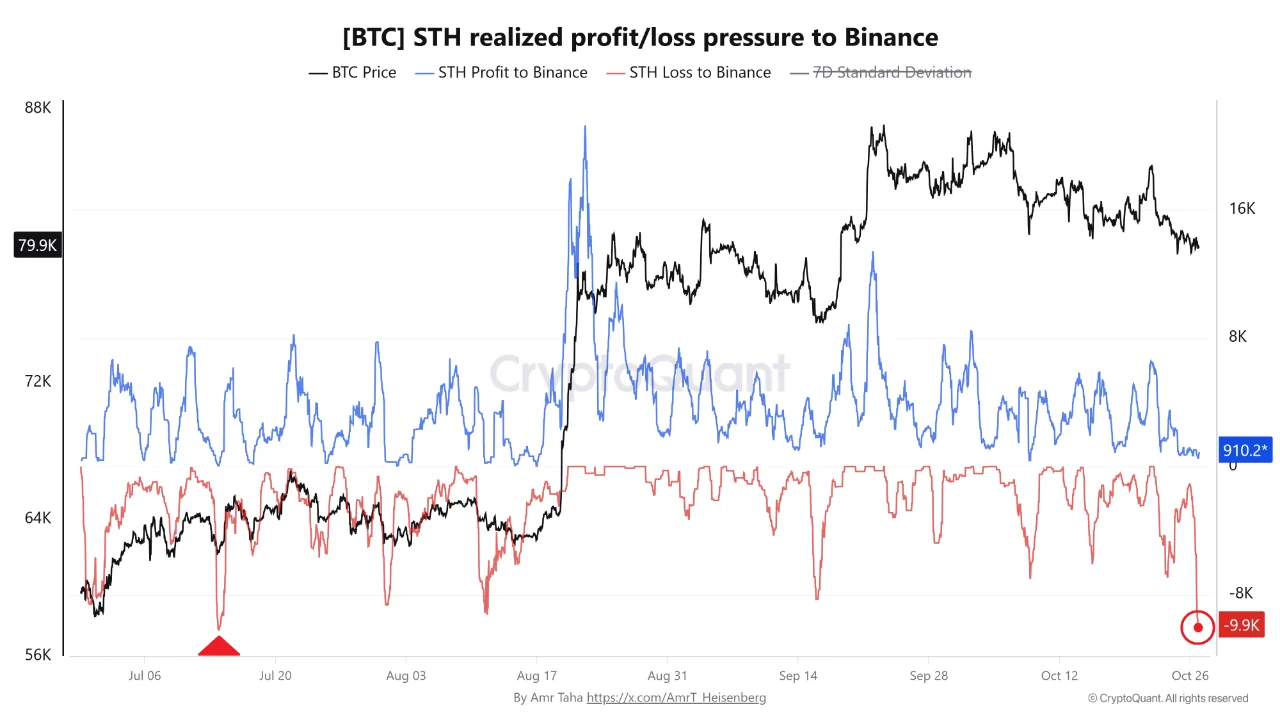
That nearly matches the −10,232 BTC recorded on July 13, when Bitcoin traded near $62,000. The cohort is now sending almost the same amount at a loss with the price $17,900 higher, the second-heaviest reading since June 30 in Taha’s data. Coins that reach an exchange are available to sell, though not all of them will be.
The flip came fast. On October 22, short-term holders booked $3.13 billion in net realized profit, Taha said, the most in more than 15 months. Four days later the flow had turned to losses. Coins sold at a loss were bought above today’s price, and Bitcoin spent most of October between $80,000 and $87,000.
A quiet tape, with a Fed move priced in
Little of that stress shows in daily price swings. A separate CryptoQuant report by The Daily Digits put 30-day realized volatility, a measure of how much the price actually moved, at 24.23%. That is lower than on 97% of days since March 2021, as Bitcoin slid in small steps.
Options are charging more. Implied volatility, the move traders pay to insure against, stood at 36.69% for Deribit’s November 27 expiry. For the October 28–29 Fed window, the report priced a 2.27% move, about $1,819, with forward implied volatility of 43.4% for those two days against 34.8% afterward. That is a range in either direction, not a target.
Calm does not have to end in a surge. Between April 2022 and September 2026, implied volatility exceeded what the following 30 days delivered in 73.8% of 1,613 observations. Leverage shows no build-up either: the all-exchange estimated leverage ratio has held between about 0.22 and 0.26 for a month, last at 0.246.
What could break the calm this week
The Fed announces its decision at 18:00 UTC on October 28, with the press conference at 18:30, per the Fed’s calendar. As of Monday, CME FedWatch priced a hold at around 90%, so the reaction is likely to hinge on what Chair Kevin Warsh says about December, where markets still lean toward another hike.
Two more events follow. About $11 billion in Bitcoin options expire on Friday, October 30, which can add volatility as traders close or roll positions near key strikes. The US midterm elections on November 3 then put crypto policy back in focus.
Below the 50-day, with $76,000 next
On the chart, Bitcoin sits about 8.5% below its swing high near $87,400 and under two hurdles: the 23.6% Fibonacci retracement at $80,370 and the 50-day SMA at $81,866. Tuesday’s session high of $80,388 briefly cleared the first before price slipped back.
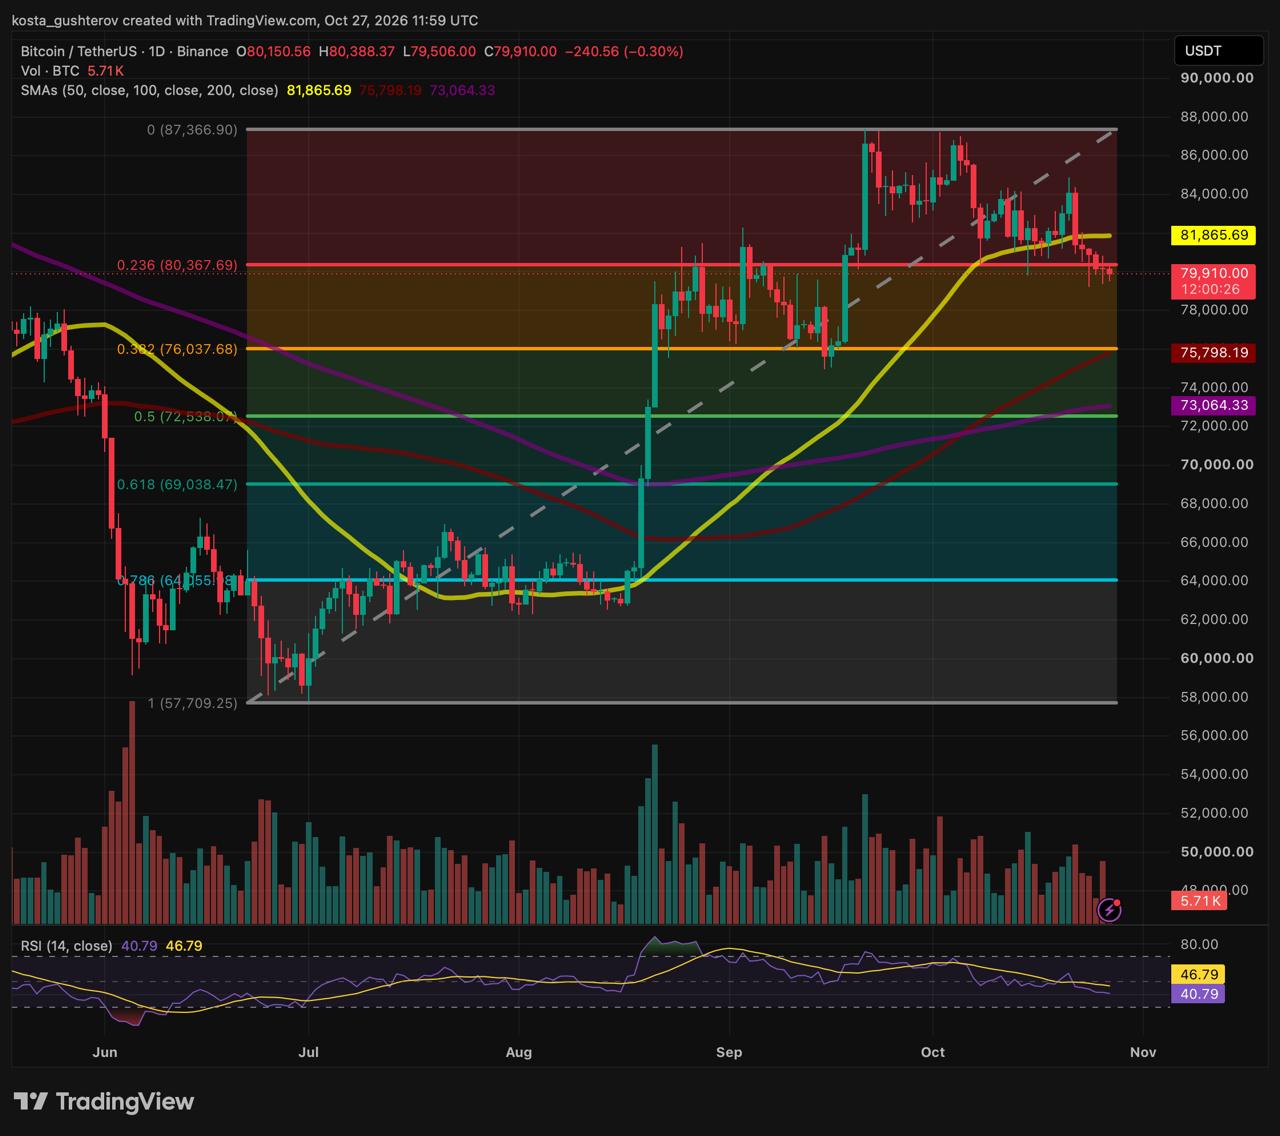
The first solid support below is a tight band between the rising 100-day SMA at $75,798 and the 38.2% retracement at $76,038. Beneath it, levels spread out: the 200-day SMA at $73,064, the 50% retracement near $72,540 and the 61.8% retracement close to $69,050.
Potential Moves (not a forecast)
Bitcoin sits just under $80,000, between the 23.6% Fib overhead and the 100-day SMA below.
Upside: Daily closes back above $80,000, followed by the $80,500 pivot and the 50-day SMA at $81,866, could reopen the $84,000 range top, with the $87,367 swing high beyond it.
Rejection: If rallies stall between $80,368 and $81,866 and daily closes stay below $80,000, the $75,800–$76,000 band becomes the next test.
Bigger picture: Holding that band keeps this a pullback within the summer advance. Losing it, and then the 200-day SMA near $73,064, would put the trend itself in question.
This article is provided for informational purposes only and does not constitute financial or investment advice. Technical levels and market indicators do not guarantee future price movement.



Kosta has reported on cryptocurrency markets and blockchain infrastructure since 2020, bringing over six years of hands-on experience in the crypto industry built through daily tracking of markets, trends, and emerging blockchain developments. Specializing in Bitcoin on-chain analysis, institutional ETF flows, and digital asset price action, his work at Coindoo has been cited by other news agencies and consistently covers market developments with a focus on data-driven reporting across Bitcoin, Ethereum, Solana, and XRP. Over the years, Kosta has contributed to multiple crypto media outlets in different regions, authoring over 6,000 articles across the sector. His reporting spans cryptocurrency markets and the broader fintech industry, tracking not only price action but also the technological and regulatory forces shaping the ecosystem. To support his analysis, Kosta actively leverages on-chain data and metrics from leading platforms such as Santiment, Glassnode, and CryptoQuant, enabling deeper, evidence-based market insights. He believes in the power of transparency and the data that underpins the blockchain ecosystem. His academic background in Marketing Management from Denmark further complements his analytical approach, adding a strong understanding of communication strategy and content positioning to his work.