Bitcoin Price Holds $77,500: Can It Pass Its Major Test?

Bitcoin is holding above $75,880 after its sharp rebound, but the next move depends on whether fresh spot demand can carry price through the $81,480 ceiling.
Key Takeaways
- $75.9K remains Bitcoin’s first key support.
- Recent buyers are back above break-even.
- One ETF inflow does not prove demand.
- Open interest can amplify either breakout direction.
- $81.5K remains the level buyers must clear.
$75.9K is holding, but $81.5K is still unclaimed
Bitcoin has spent more than a week holding above the first Fibonacci retracement support of its recent advance. On the daily BTC/USD chart, $75,880 marks the 23.6% Fibonacci level, while $81,480 remains the recent high that BTC has not yet reclaimed.
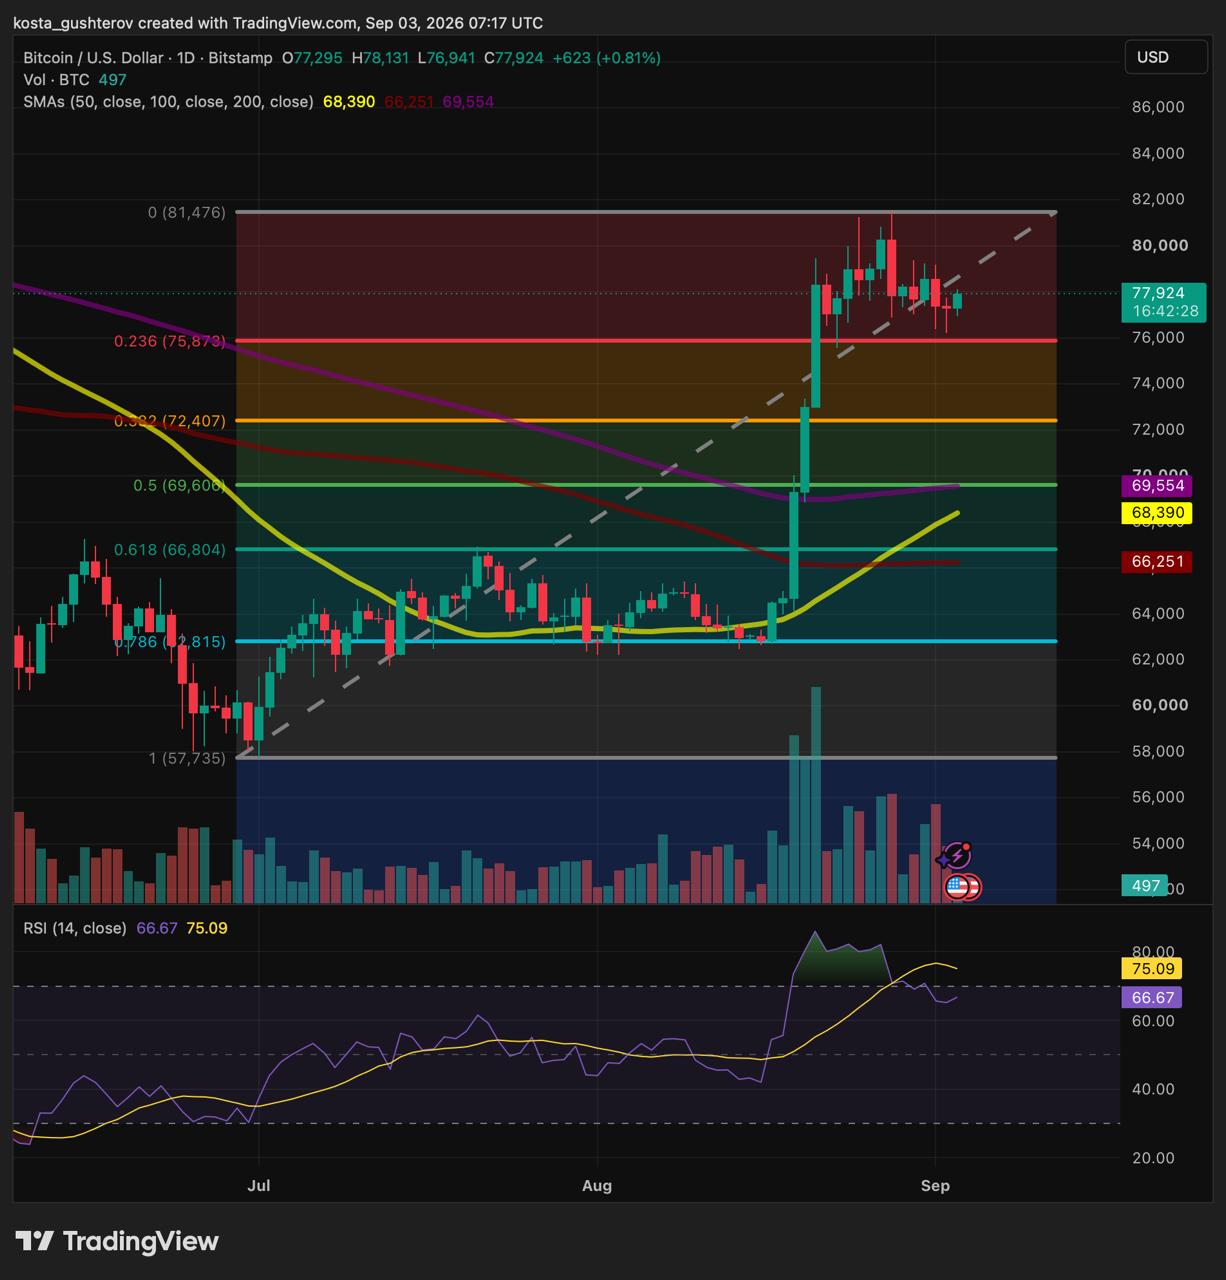
The daily structure remains constructive. BTC is above its 50-, 100- and 200-day moving averages, while RSI has cooled to about 66.7 after its earlier spike but remains above 60. That suggests momentum is pausing beneath resistance rather than confirming a breakout.
A hold above support and a push through resistance require different things. The first can happen when sellers run out of urgency. The second needs buyers willing to keep adding exposure at higher prices.
Recent buyers are no longer pinned to break-even
The CryptoQuant holder-metrics chart above places BTC above both the ETF and short-term-holder cost-basis area. In plain terms, short-term holders and ETF investors are no longer clustered around a price where they need a rebound simply to exit near their average entry.
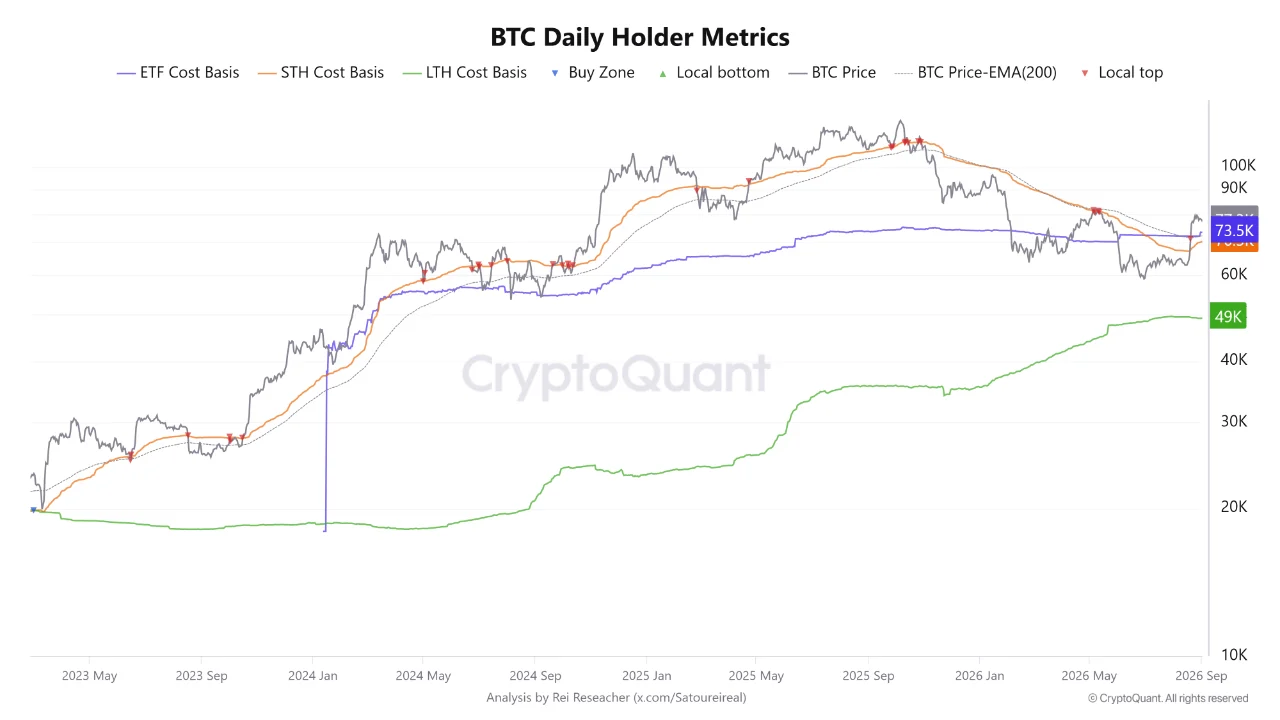
That reduces one common source of selling pressure. When price trades around a recent buyer’s average entry, a bounce can trigger exits from people trying to recover their capital. Once BTC holds above that area, the same group has less immediate reason to sell for that reason alone.
Profit-taking can still emerge. What has changed is the market’s immediate question: will fresh capital absorb any selling that appears as BTC approaches resistance?
One green ETF day is a start, not proof
The first sign of fresh buying has appeared, but the evidence remains limited. Farside Investors data shows US spot Bitcoin ETFs recorded a $236.5 million net outflow on September 1, followed by a $101.1 million net inflow on September 2.
The return to inflows interrupted the previous day’s selling but it does not yet cancel it out or establish a sustained buying trend. BTC needs several sessions of consistent demand before ETF flows can support a move through $81.5K.
The next useful confirmation will come if the Coinbase Premium turns and holds positive, and if exchange netflows avoid a large move toward exchanges. A sustained premium would show stronger buying on Coinbase’s USD market than on Binance’s USDT market, while heavy exchange inflows could signal that holders are preparing to sell into the rebound.

Leverage can make the next move look stronger than it is
When checked on September 3, Bitcoin was trading near $77,900 on CoinGlass, where aggregate BTC open interest stood near $53 billion. The same dashboard showed roughly $67 billion in 24-hour futures volume, compared with about $4 billion in spot volume across its tracked venues.
Those figures explain why a move through either side of the current range can accelerate quickly. A sharp increase in open interest and funding as price approaches $81.5K would suggest traders are crowding into the move. A breakout supported by ETF buying and relatively calm funding would be a healthier sign of spot-led demand. Coindoo’s recent look at old coins testing spot demand explains why a rising price is stronger when new buyers are absorbing available supply.
Traders can track the live BTC funding rate and liquidation data alongside price. They show whether the market is building a stable move or simply adding leverage that can be forced out in the opposite direction.
The chart now gives Bitcoin a clear demand test
What could confirm strength
Bitcoin holds above $75,880, ETF inflows extend beyond one session and BTC closes convincingly above $81,480 without a sharp rise in crowded leverage.
What might weaken the recovery
ETF demand fades, BTC loses $75,880 and exchange inflows rise. That would bring $72,400 into focus before the deeper $69,600 support zone.
The $69,600 area matters because it combines the 50% Fibonacci retracement with the 200-day moving average near $69,550.
BTC has defended its first support, but that is only the starting point. A sustained move above $81.5K now depends on spot demand becoming strong enough to absorb profit-taking without relying on a leverage-driven squeeze.



Alex is Editor-in-Chief of Coindoo and co-founder of Millennial Media Group, with nearly a decade of experience covering financial markets - crypto first, then everything else. It started in 2016 with Bitcoin. Like most people at the time, he didn't fully understand it - so he kept digging. Blockchain, tokenomics, the projects, the cycles. That curiosity never stopped, and eventually pulled him into traditional markets too: equities, commodities, macro. Not because he left crypto behind, but because you can't properly understand one without the other. What drives him is straightforward: he wants to know why something is happening, not just that it's happening. Most market coverage stops at the headline - price up, price down, here's a chart. Alex finds that kind of reporting actively unhelpful. If you walk away from an article without understanding the mechanism behind the move, what did you actually learn? He holds a degree in Tourism from New Bulgarian University - not the most obvious path into financial markets, but markets have a way of pulling in people who are simply too curious to stay out. He has authored over 200 in-depth analyses and more than 10,000 articles across crypto and traditional finance. He still thinks every day in markets teaches him something new. That's probably why he hasn't stopped.