Bitcoin Price Hits $84,000 as the May High Gives Way

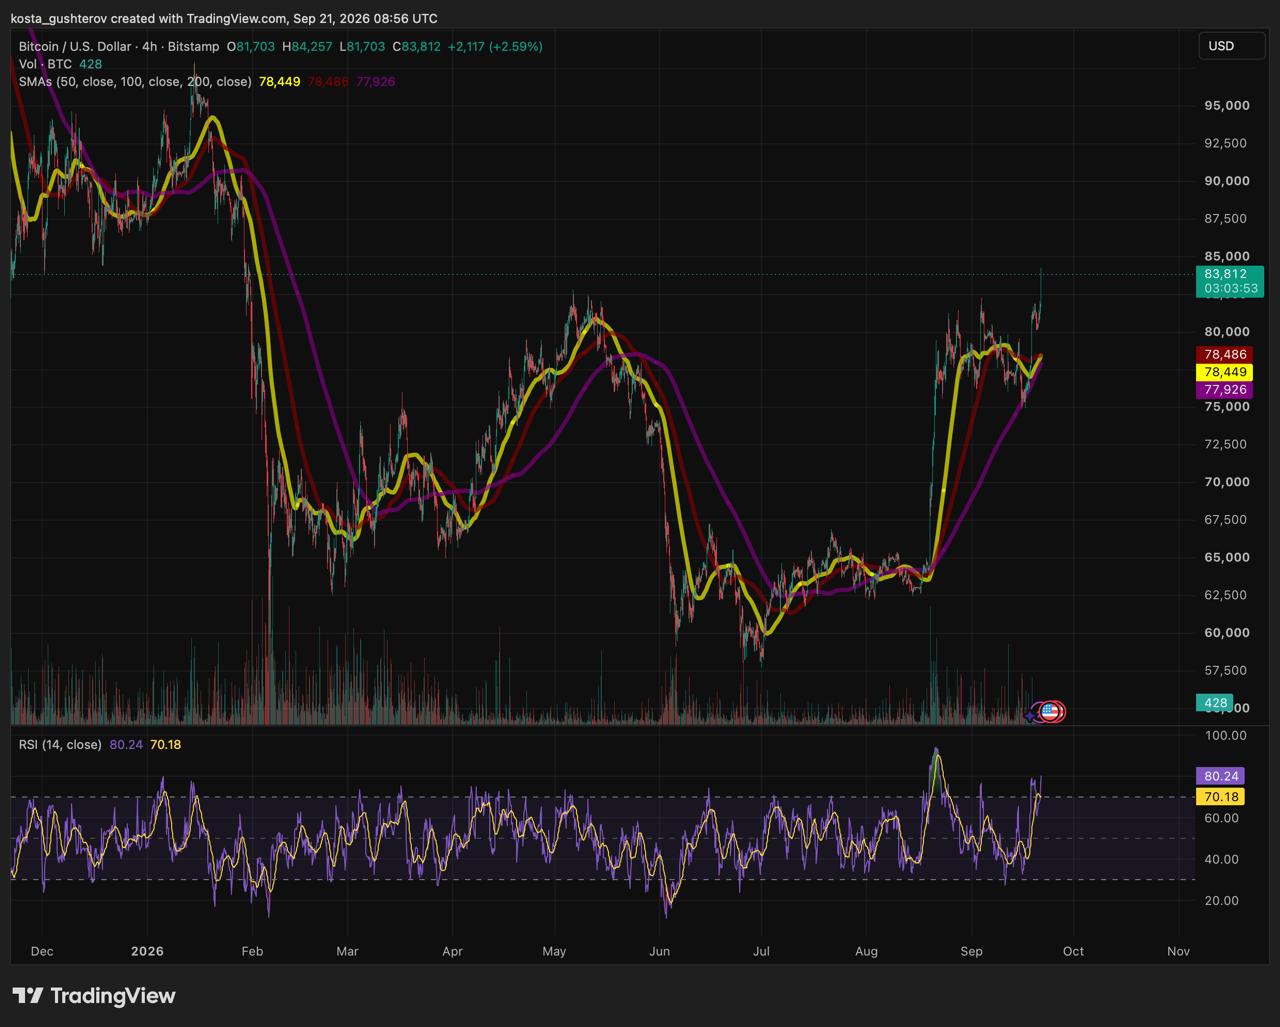
Bitcoin briefly traded above $84,000 before easing to $83,800. Its move beyond May’s $82,800 swing high coincided with a concentrated wave of short liquidations.
The May high gave way
Bitcoin reached $84,257 on the Bitstamp BTC/USD four-hour chart before returning to approximately $83,800 at 08:56 UTC on September 21. That placed it above the May 2026 swing high near $82,800.
This was not a new high for 2026. Bitcoin traded around and above the same area in late January before the February sell-off.
The advance also cleared the wider $80,000-$82,300 resistance area identified when Bitcoin previously rebounded from $76,500-$77,000. That leaves $82,800 as the first level to watch if price pulls back.
Most of Bitcoin’s liquidations arrived within one hour
When the CoinGlass figures were checked, the platform had recorded $218.58 million in Bitcoin liquidations during the previous hour.
Bitcoin liquidations during the peak hour
Total: $218.58 million
Short positions: $212.78 million
Long positions: $5.80 million
Short share: Approximately 97.3%
That single hour represented approximately 79% of Bitcoin’s $275.33 million liquidation total for the full 24-hour period.
The wider crypto market recorded $271.50 million in liquidations during the same hour, including $261.98 million in shorts. Bitcoin therefore accounted for approximately 80.5% of all market liquidations and 81.2% of the short positions closed during that window.
The concentration occurred during the same period in which price moved through $82,800. That timing supports the conclusion that forced short covering accelerated the advance.
The imbalance also appears in the 24-hour figures
Over 24 hours, CoinGlass recorded $598.72 million in market-wide liquidations. Bitcoin contributed $275.33 million, or approximately 46% of that total.
- BTC shorts: $256.65 million
- BTC longs: $18.69 million
- Short share of BTC liquidations: 93.2%
- BTC share of market short liquidations: 50.9%
CoinGlass reported 126,991 liquidated traders across the market during the 24-hour period. Its Bitcoin dashboard displayed 12,862 affected traders, while the largest single liquidation was an approximately $11.29 million BTCUSDT position on Binance.
The figures confirm forced closures, not private stop orders
A short position benefits when Bitcoin falls. If the price rises too far, an exchange can forcibly close a leveraged short before its collateral becomes insufficient. Closing it requires buying Bitcoin, so several liquidations occurring together can push the price higher and trigger the next group of vulnerable positions.
The one-hour figures show that this process accelerated the move. They do not establish that liquidations started the rally. Buying pressure first had to lift Bitcoin into the prices where leveraged shorts became vulnerable.
Traders may also have placed conventional stop-loss or breakout orders above $82,800. Previous swing highs commonly attract both, but those private instructions are not visible before they execute.
Confirmed: $212.78 million in BTC shorts were liquidated within one hour. Not confirmed: how many ordinary stop-loss or breakout orders were waiting above $82,800.
Three prices now define the setup
Above $84,257: the advance continues
A four-hour close above the intraday high would confirm that Bitcoin finished a trading period beyond $84,000. It would not amount to a new 2026 high: the late-January trading area means BTC is returning to prices with recent trading history rather than entering an untested range.
Holding $82,800: the May ceiling becomes support
A pullback that attracts buyers near $82,800 would provide stronger confirmation than the initial surge. It would show that demand remained after forced short covering slowed.
Below $82,800: $80,000 returns to focus
A quick return below the previous high would turn attention back to $80,000. Beneath that, the 50-, 100- and 200-period moving averages form a tighter support cluster between approximately $77,900 and $78,500.
Bitcoin approaches those tests with four-hour RSI near 80. The reading shows unusually fast momentum but does not require an immediate decline; strong advances can remain overbought while demand continues absorbing available supply.
The test begins after forced buying fades
The short liquidations help explain the speed of the move, but that source of buying disappears once vulnerable positions are closed. A successful retest of $82,800 would show that ordinary demand, not only forced purchases, is prepared to support the higher range. A rapid fall back below it would suggest that Bitcoin only moved above resistance long enough to trigger existing orders, without establishing support.
- Update: At 09:32 UTC, Bitcoin was trading near $84,450. Updated liquidation data showed $311.25 million in BTC positions closed over 24 hours, including $292.21 million in shorts and $19.04 million in longs. The latest one-hour total had risen to $244.19 million, with shorts accounting for $238.42 million, or nearly 98%. The figures indicate that forced short closures remained concentrated as Bitcoin moved further above its May high.
This article is provided for informational purposes only and does not constitute financial or investment advice. Cryptocurrency prices, leverage and liquidation totals can change rapidly.



Kosta has reported on cryptocurrency markets and blockchain infrastructure since 2020, bringing over six years of hands-on experience in the crypto industry built through daily tracking of markets, trends, and emerging blockchain developments. Specializing in Bitcoin on-chain analysis, institutional ETF flows, and digital asset price action, his work at Coindoo has been cited by other news agencies and consistently covers market developments with a focus on data-driven reporting across Bitcoin, Ethereum, Solana, and XRP. Over the years, Kosta has contributed to multiple crypto media outlets in different regions, authoring over 6,000 articles across the sector. His reporting spans cryptocurrency markets and the broader fintech industry, tracking not only price action but also the technological and regulatory forces shaping the ecosystem. To support his analysis, Kosta actively leverages on-chain data and metrics from leading platforms such as Santiment, Glassnode, and CryptoQuant, enabling deeper, evidence-based market insights. He believes in the power of transparency and the data that underpins the blockchain ecosystem. His academic background in Marketing Management from Denmark further complements his analytical approach, adding a strong understanding of communication strategy and content positioning to his work.