Bitcoin: Analysts Say the Bottom Is In and Here Is What They Are Watching Next

Institutional and technical voices have converged on the same conclusion from entirely different starting points - volatility data, Elliott Wave structure, weekly RSI extremes, and fundamental demand analysis. This article covers each case and what the price chart shows right now.
Key Takeaways
- Bernstein officially called Bitcoin’s bottom.
- CoinDesk’s volatility analysis places the actual bottom near $60,000.
- Bitcoin’s weekly RSI is oversold for only the fourth time in history.
- A bear market signal with a perfect three-instance track record has flashed again.
Bernstein Calls the Bottom
According to Investing report, analysts at Bernstein stated that BTC has likely found its bottom and is heading higher. The firm reaffirmed its year-end price target of $150,000 for 2026.
The core of Bernstein’s argument is the absence of the conditions that made previous downturns structurally damaging. There are no leverage collapses. No exchange failures. No systemic breakdown in market infrastructure. The firm describes this as the weakest bear case in Bitcoin’s history. What drove the drawdown was sentiment, not structure.
Bernstein also points to institutional alignment as a stabilizing force. Spot Bitcoin ETF inflows and expanding corporate treasury demand have created a demand base that previous cycles did not have. Strategy, which recently bought for $76,6 million, is cited specifically as a long-term stability driver. As financial conditions improve and Federal Reserve rate cuts become more likely, Bernstein expects ETF inflows to accelerate further.
What the Volatility Data Shows
CoinDesk’s analysis points to the same conclusion from a different angle, and places the actual bottom even lower. According to their reporting, Bitcoin’s implied volatility measured through DVOL and BVIV spiked above 90% in early February as price dropped sharply.
That level is consistent with two prior capitulation events. In August 2024, implied volatility reached similar levels before price bottomed near $50,000. In November 2022, when FTX, which recently kicked off $2.2B distribution round, collapsed and Bitcoin fell below $20,000, the same spike occurred and marked the floor.
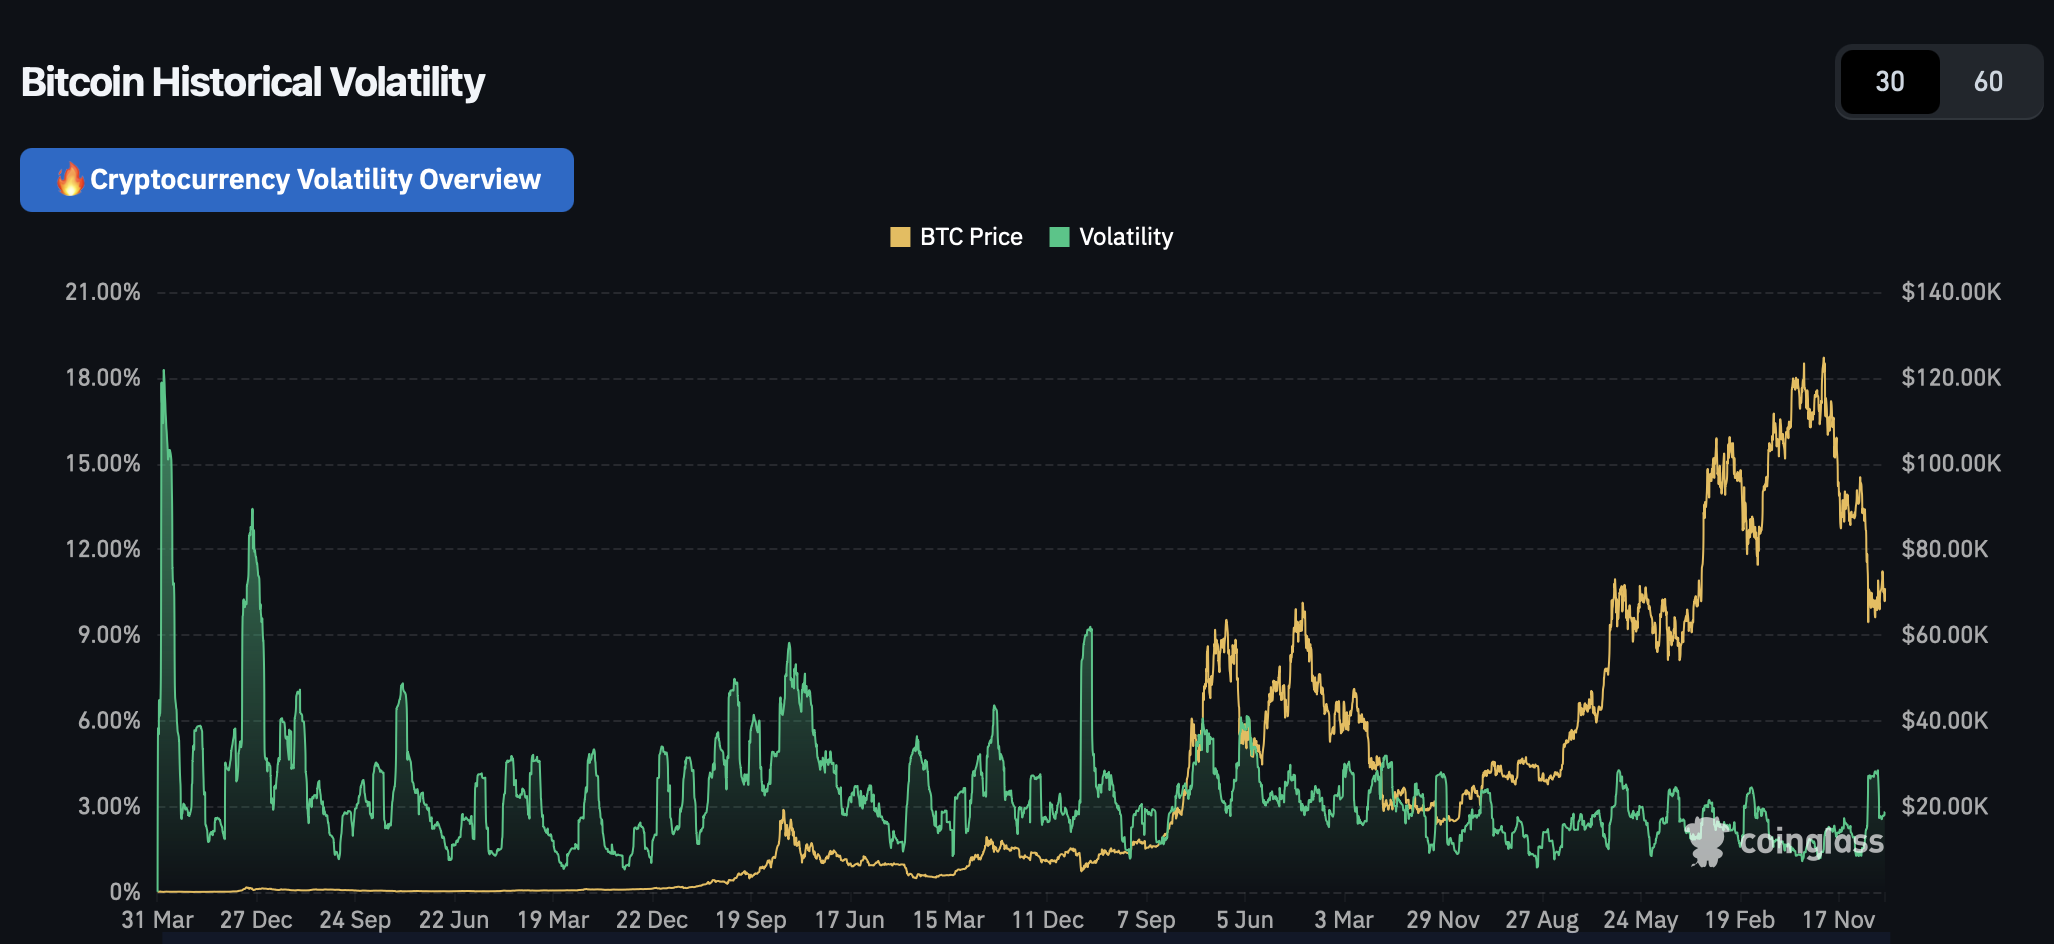
The argument is that extreme implied volatility readings in Bitcoin function the same way an elevated VIX functions in traditional markets, as a contrarian buy signal reflecting peak fear rather than rational selling. Quantitative funds in equity markets use VIX spikes above long-term averages to trigger systematic purchases. The same logic applied to February’s Bitcoin volatility spike suggests the sell-off was driven by panic. The VIX itself reached a one-year high of 35% on March 9, adding broader macro context to the fear environment.
CoinDesk concluded that if history is a guide, the Bitcoin downtrend that began in October above $126,000 has already ended. Their implied floor from the volatility pattern sits near $60,000, the level reached during the February capitulation.
What The Analysts are Thinking
Analyst Merlijn The Trader posted two technical frameworks that add a different layer to the same argument.
The first is the weekly RSI. According to his analysis, Bitcoin’s weekly RSI is currently oversold for only the fourth time in its history. The three prior instances were in 2019, 2020, and 2022. The rallies that followed those readings were 2,700%, 1,800%, and 350% respectively.
BITCOIN WEEKLY RSI IS OVERSOLD FOR THE FOURTH TIME IN HISTORY.
2019: oversold. Then 2,700% rally.
2020: oversold. Then 1,800% rally.
2022: oversold. Then 350% rally.
2026: oversold. Right now.Hold $65K: wave 4 complete. Wave 5 to $140K begins. Lose it: oversold gets more… pic.twitter.com/Em27L00u7j
— Merlijn The Trader (@MerlijnTrader) March 24, 2026
His framework identifies $65,000 as the key level. Above it, he counts the current move as wave 4 of an Elliott Wave sequence completing, with wave 5 targeting $140,000. Below it, the RSI risks becoming more oversold before recovering.
The second framework is a bear market signal with a three-instance track record. The signal triggered in 2015 and was followed by a 48% decline.
THE BITCOIN BEAR MARKET SIGNAL HAS A TRACK RECORD.
2015: triggered. -48% followed.
2018: triggered. -42% followed.
2022: triggered. -55% followed.
2026: triggered. -0% so far.Pattern isn't complete yet.
Reclaim $70K: signal invalidates. Bulls win.
Stay below it:… pic.twitter.com/qKATUiCCu7— Merlijn The Trader (@MerlijnTrader) March 23, 2026
It triggered in 2018 and a 42% decline followed. In 2022 it triggered ahead of a 55% decline. It has now triggered again in 2026. His framing is direct: reclaim $70,000 and the signal invalidates. Stay below it and the historical pattern completes. Three signals. Zero false alarms so far.
Bitcoin’s Price
Bitcoin is trading at $69,867 at the time of writing. The daily chart shows a downtrend from above $125,000 in October through a low near $60,000 in early February. Price recovered through late February and into March, briefly crossing above $75,000 before pulling back. The 50-day moving average sits at $69,033 and is still declining. Bitcoin is trading just above it.
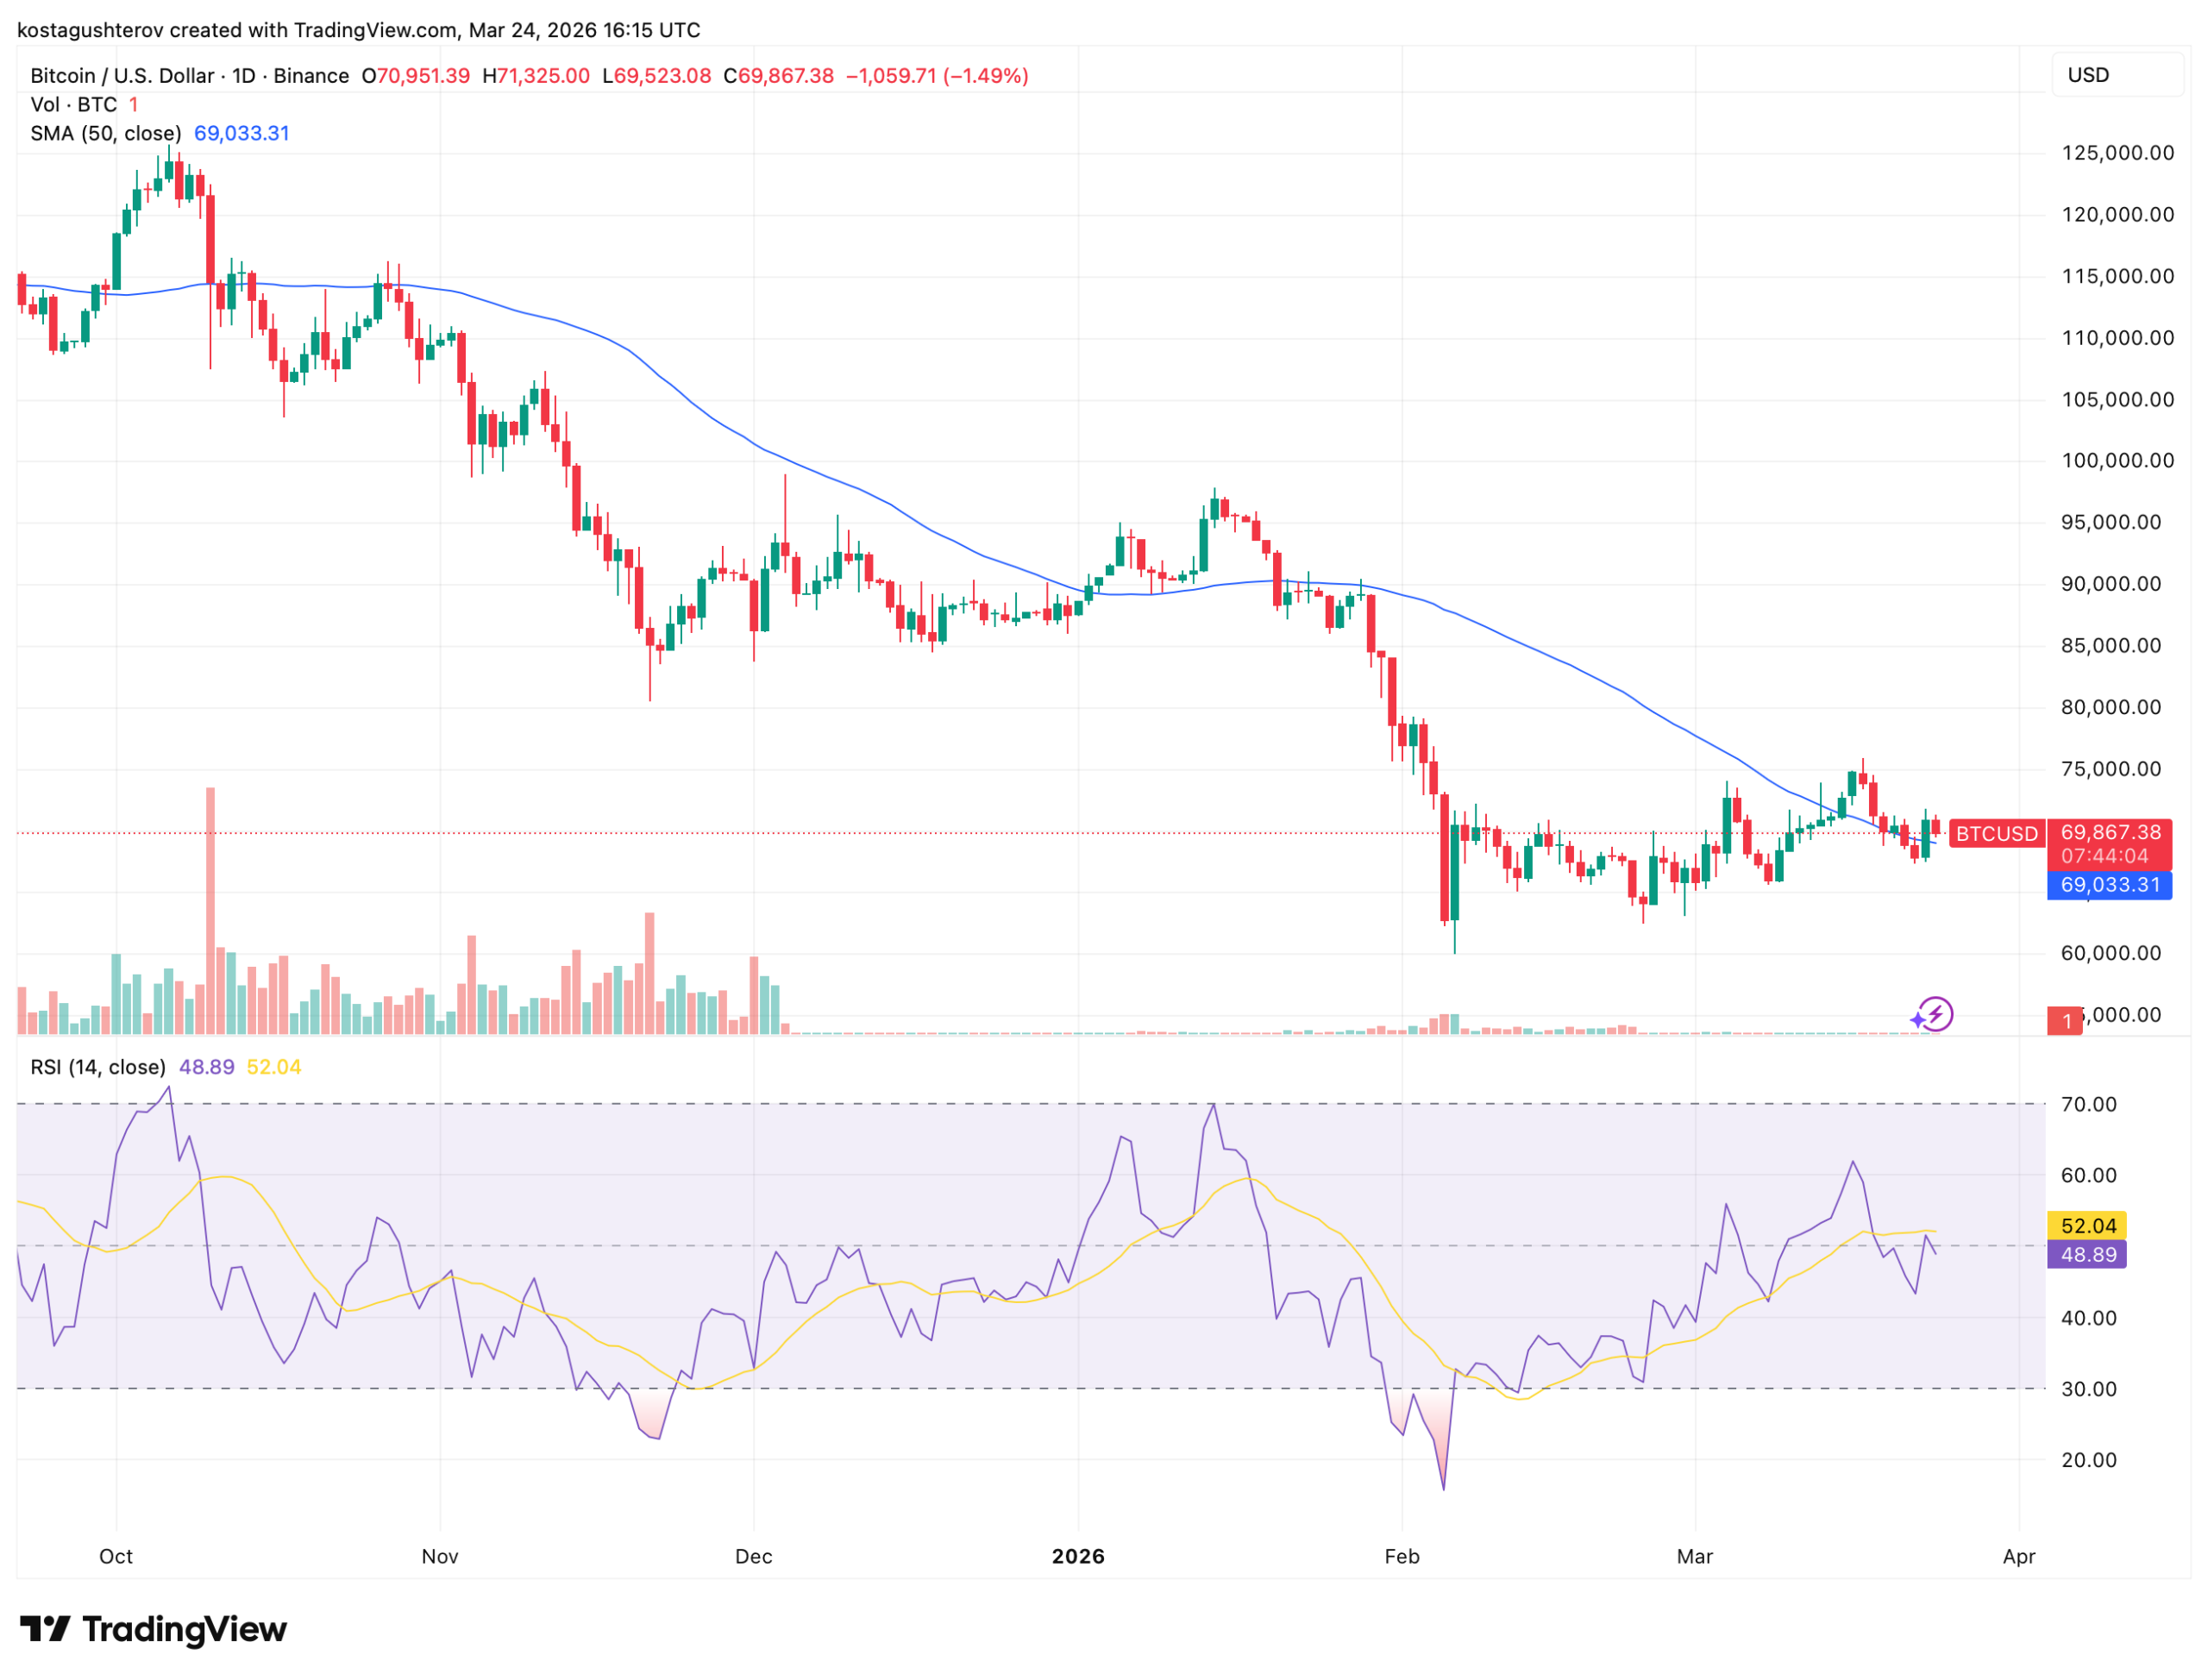
The RSI on the daily is at 48.9, below its smoothed average of 52.04. Momentum has not confirmed the recovery. The price is at exactly the level where the two technical frameworks above either hold or break.

Kosta joined the team in 2021 and quickly established himself with his thirst for knowledge, incredible dedication, and analytical thinking. He not only covers a wide range of current topics, but also writes excellent reviews, PR articles, and educational materials. His articles are also quoted by other news agencies.