XRP On-Chain Data Is Showing Two Contradictory Signals at Once
XRP's on-chain data is sending contradictory signals simultaneously - institutions are buying through ETFs while liquidity collapses, the derivatives market loads short, and the scarcity index hits its highest level since 2024.
Key Takeaways
- XRP recovering at $1.34 after touching $1.31 low this week.
- AMM liquidity collapses to $1.9M, DEX liquidity down from $280B to $104B.
- Open interest drops -$76M on Binance and -$61M on Bybit simultaneously.
- Scarcity index hits highest level since 2024.
- XRP ETFs record +$2.66M inflows week of March 23–27.
XRP is trading at $1.34, more than 60% below its last all-time high, holding inside a range it has occupied for months. The price itself tells you almost nothing. The on-chain data beneath it tells you two things simultaneously, and they point in opposite directions.
Liquidity on the XRP Ledger is collapsing. Mid-sized holders are quietly withdrawing coins from exchanges at the highest rate since 2024. Both are real. Both are happening right now. The question is not which signal is correct, it is which one fires first.
What the Chart Shows
On the one-hour Binance chart, XRP spent March 27 through 29 grinding lower, touching a session low near $1.3180 before a sharp recovery candle on the morning of March 30 pushed price back to $1.3650. The recovery gave back half its gains and price settled at $1.3426 by mid-session.
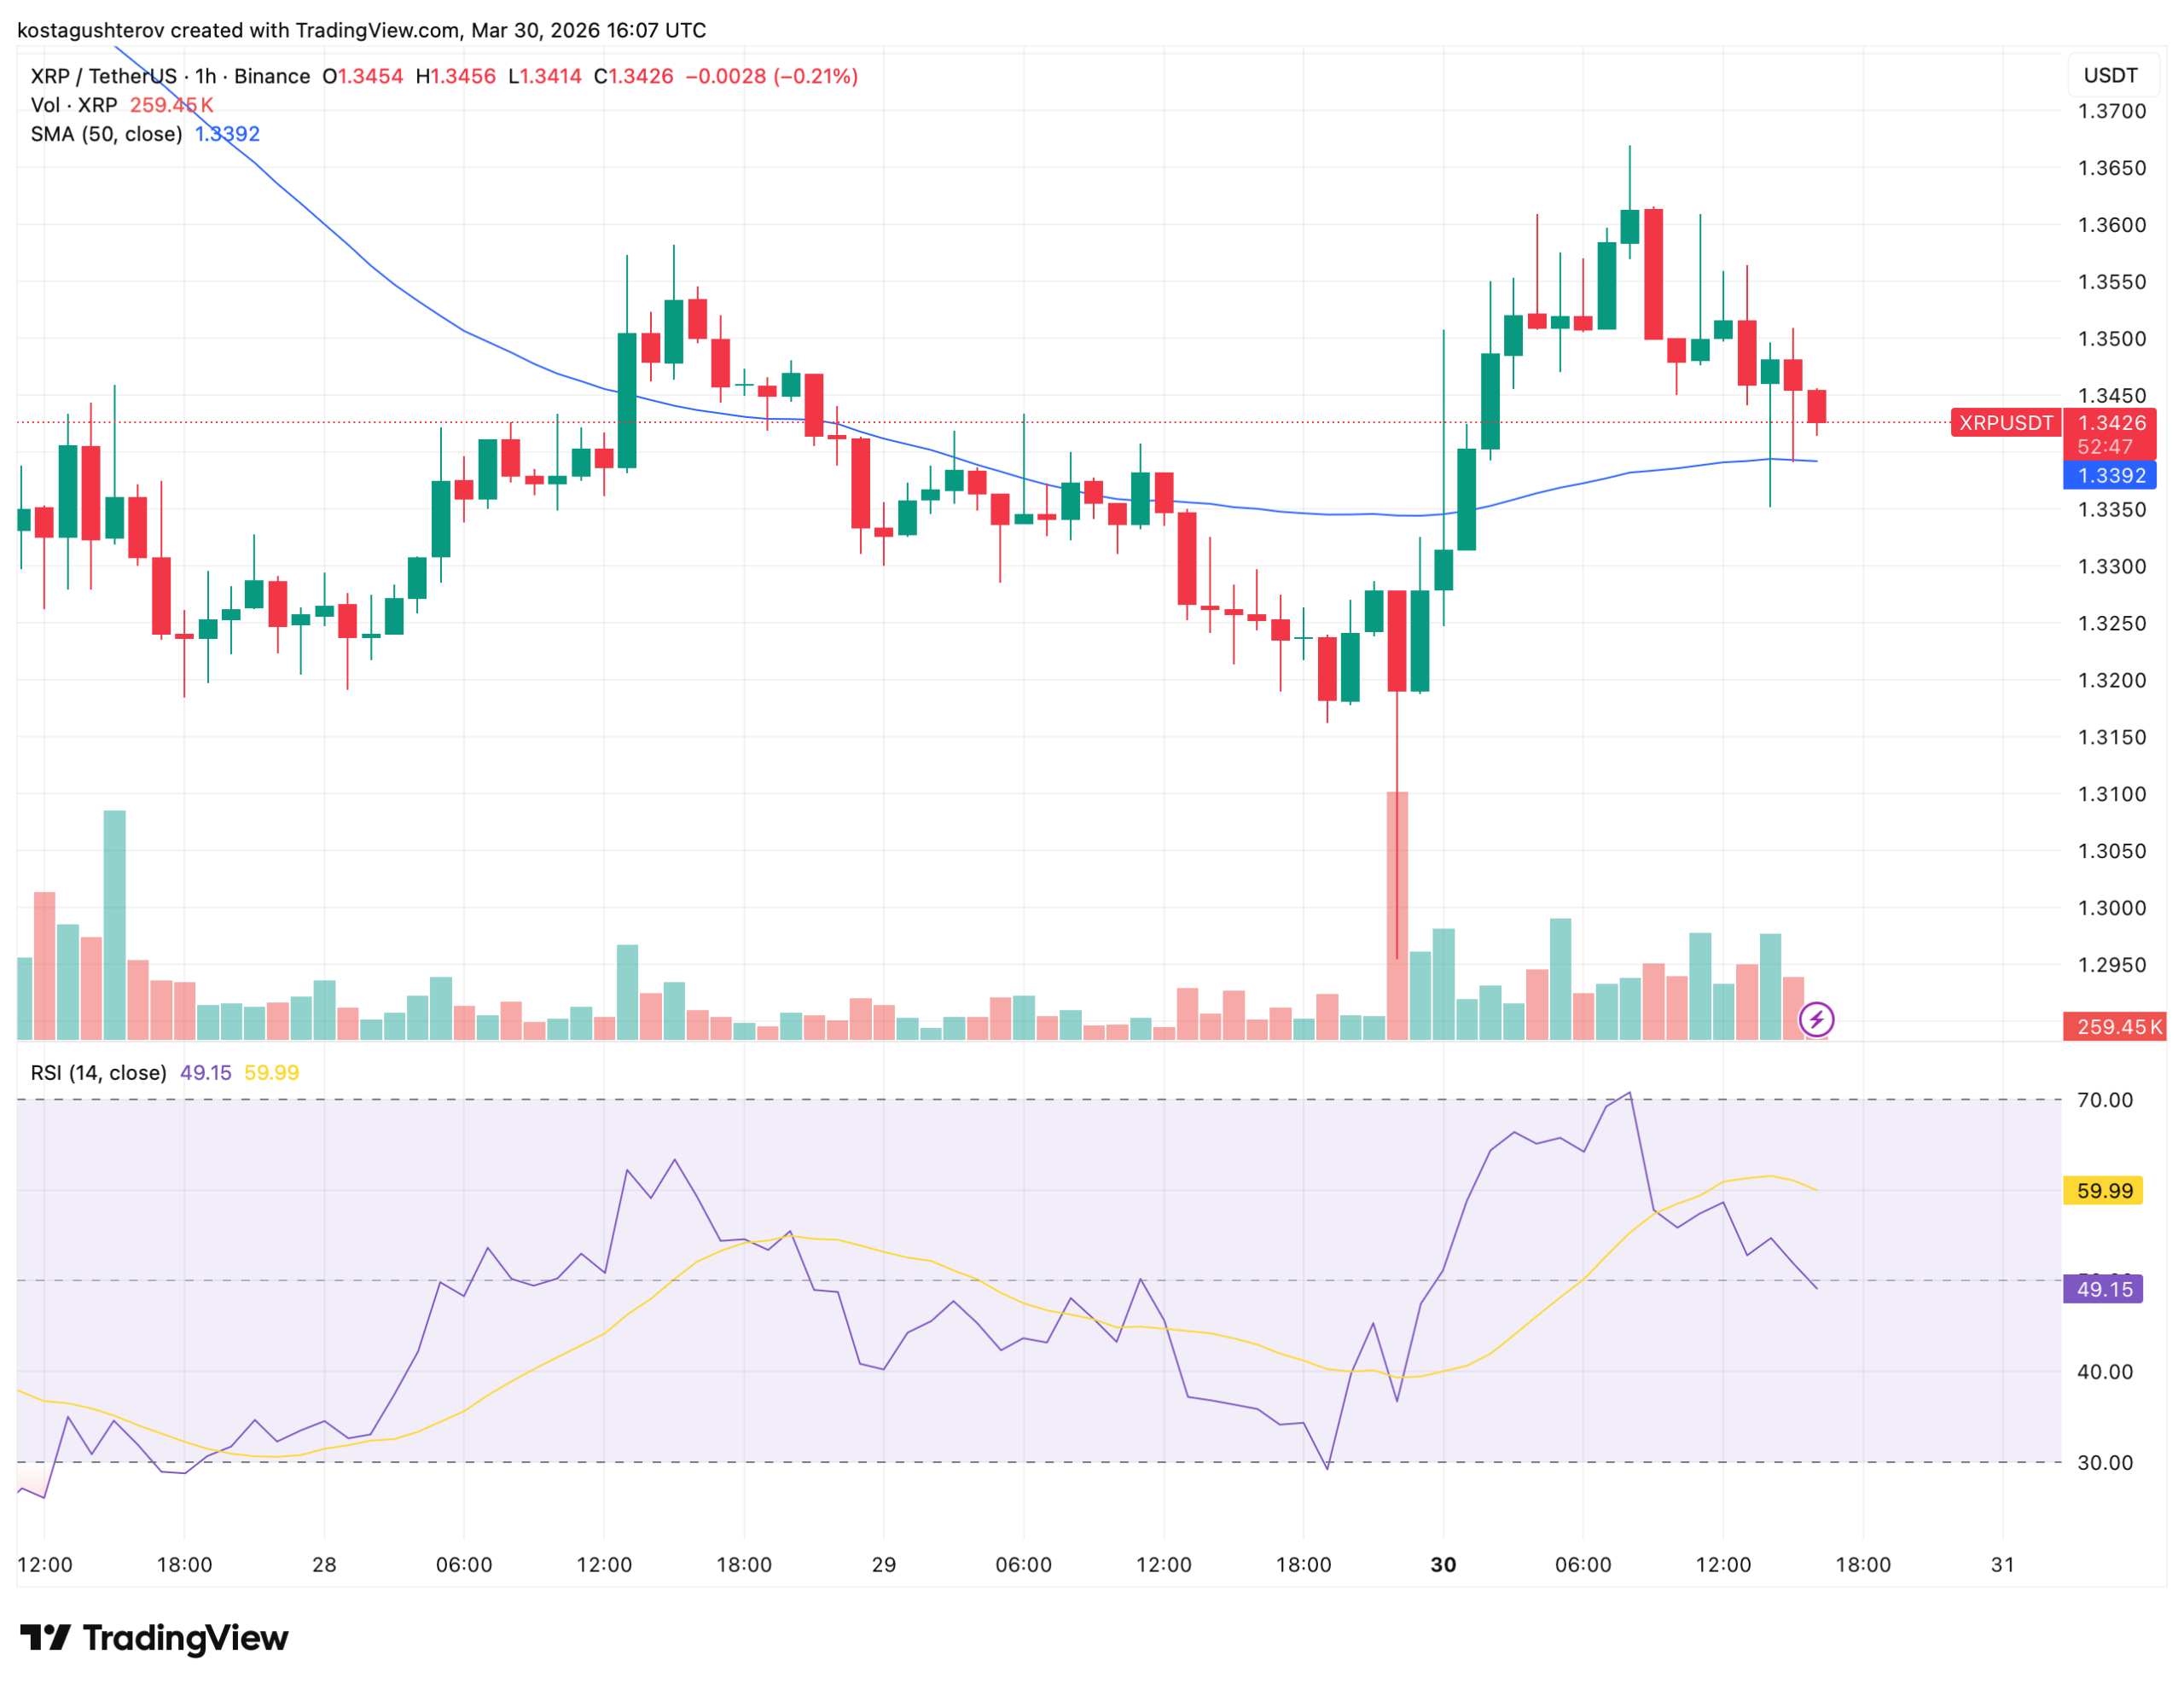
The 50-period simple moving average sits at $1.3392 – below current price and beginning to flatten after weeks of pointing steeply downward. That flattening is the first sign in this chart window that the trend may be losing its conviction, not accelerating. The RSI reads 49.15 against a smoothed signal at 59.99. Buying conviction spiked on the March 30 recovery candle and has since pulled back sharply below its own average – consistent with a relief bounce rather than a confirmed trend change.
The chart is neutral. The on-chain data is not.
The Liquidity Problem
Liquidity on the XRP Ledger has been contracting since the post-ETF peak and the contraction has not stopped. AMM pool liquidity, tracked through the MAG-XRP pool on CryptoQuant, has shrunk to $1.9 million, approaching levels last seen in November 2024. The November 2024 floor at similar liquidity levels previously ignited a rally beyond $3.00. The difference between then and now is the trajectory: that floor marked the beginning of a liquidity expansion. The current $1.9 million reading is the end of a 30-day flatline. The same number in a different context describes a completely different market.
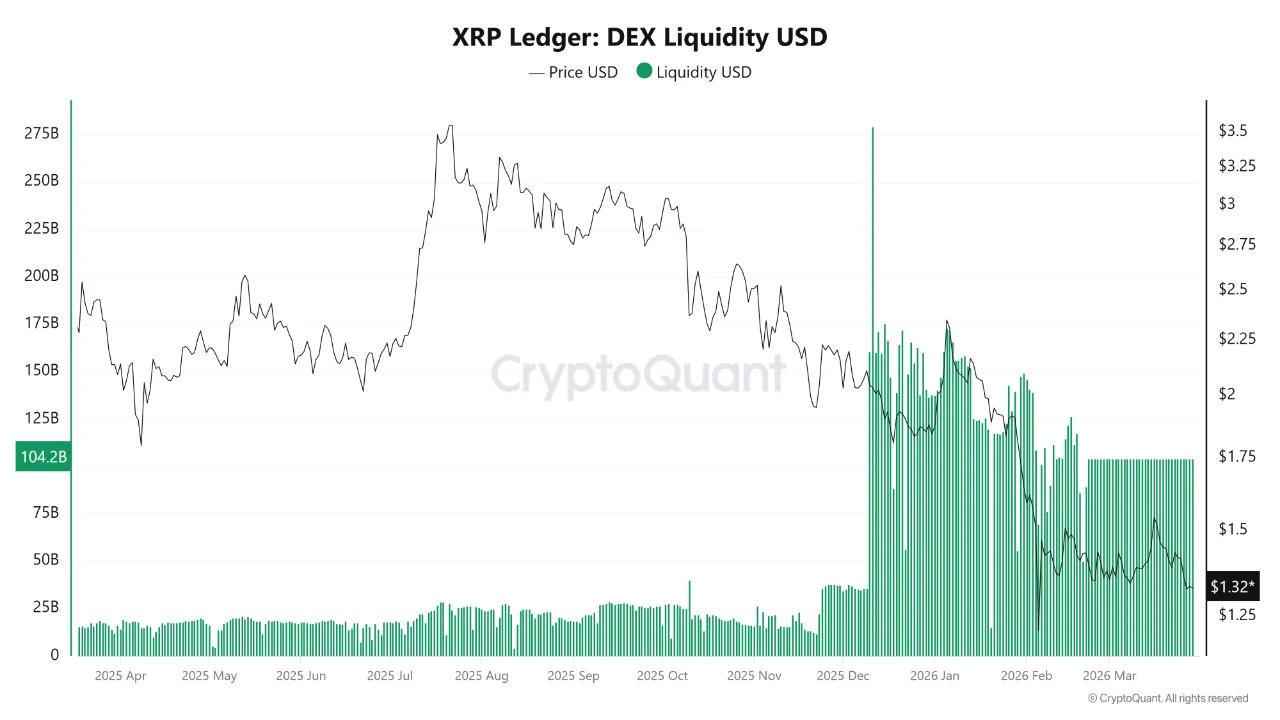
DEX liquidity has followed the same direction. At the post-ETF peak, XRP Ledger DEX liquidity reached $280 billion. It currently sits at $104.2 billion, a decline of more than 60% from the peak. For an asset that has historically required liquidity injections to sustain price, the retreat from $280 billion to $104 billion is not a minor compression. It removes the structural support that funded the previous expansion.
Compounding both of those readings, whale-to-exchange transaction volumes spiked repeatedly through February and March. Large holders moving coins to exchanges, the signal that typically precedes distribution, appeared alongside the liquidity retreat rather than in spite of it.
The Derivatives Market Confirms the Pressure
The derivatives picture reinforces the same bearish read from a different data source. On March 24, Binance’s 7-day Open Interest Change fell to negative $76 million, the deepest negative reading since early February, and significantly worse than the February comparisons of negative $47 million on February 4 and negative $44.6 million on February 6.
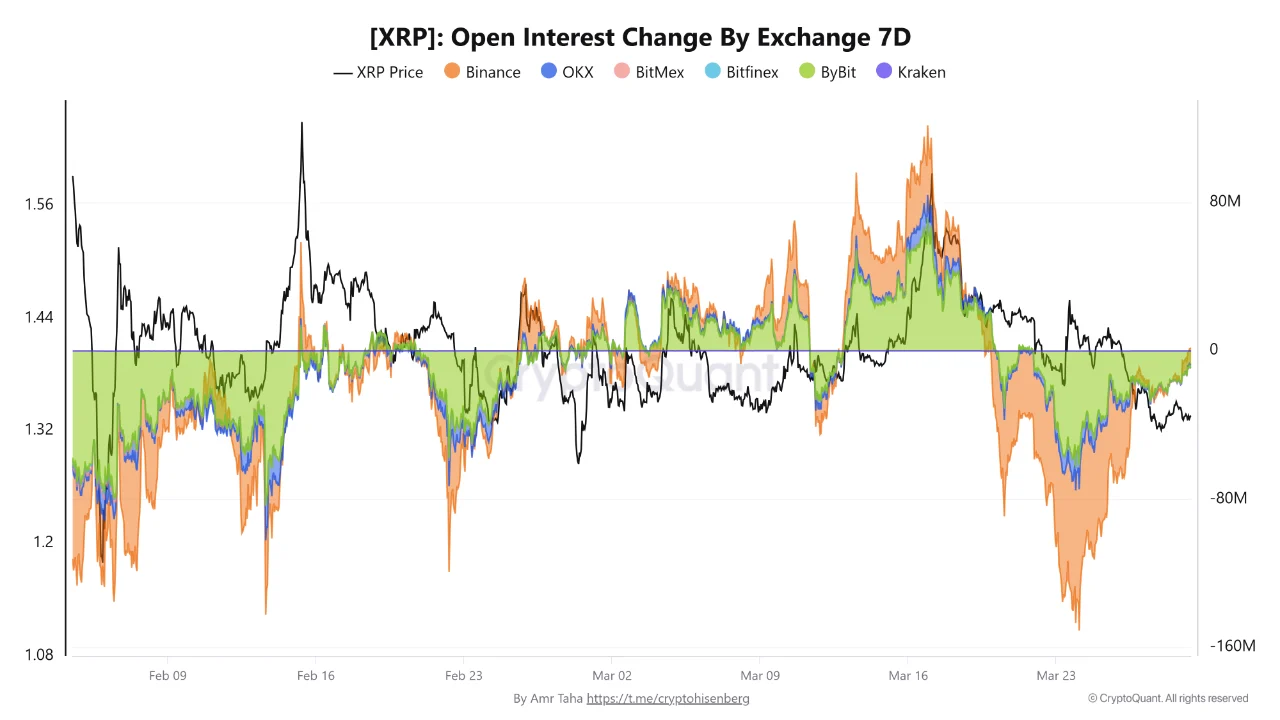
Bybit recorded a simultaneous negative $61 million on the same day. When two of the largest derivatives venues record their biggest open interest contractions of the recent period on the same day, it reflects forced positioning cleanup or a broad withdrawal of speculative appetite, not a localised exchange issue.
Funding rates reinforce the same direction. The XRP funding rate on Binance has been deeply negative for a prolonged period, with spikes reaching negative $0.01 to negative $0.02.
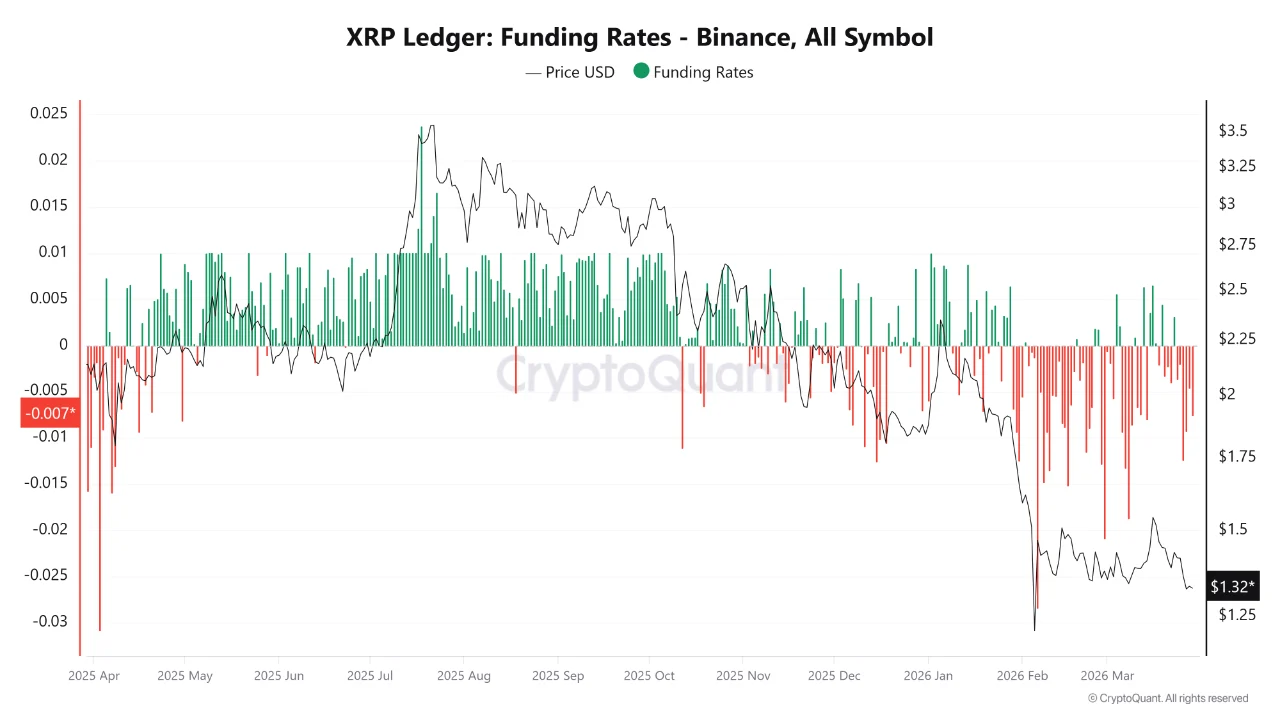
Deeply negative funding means the short side is aggressively dominant, short holders are paying longs to maintain their positions, which reflects the degree of bearish conviction in the derivatives market. When price falls and funding rates are also negative, the decline is being driven primarily by short positioning rather than spot selling. That distinction matters because short-driven declines are more susceptible to violent reversals, and it connects directly to what is happening on the accumulation side.
The Signals Pointing the Other Way
Against the liquidity collapse and the derivatives pressure, three separate on-chain readings are pointing toward accumulation rather than distribution.
The XRP Binance Scarcity Index, tracked in CryptoQuant report, has reached 0.59, its highest level since 2024. The scarcity index measures the reduction in XRP supply available for sale on the exchange.
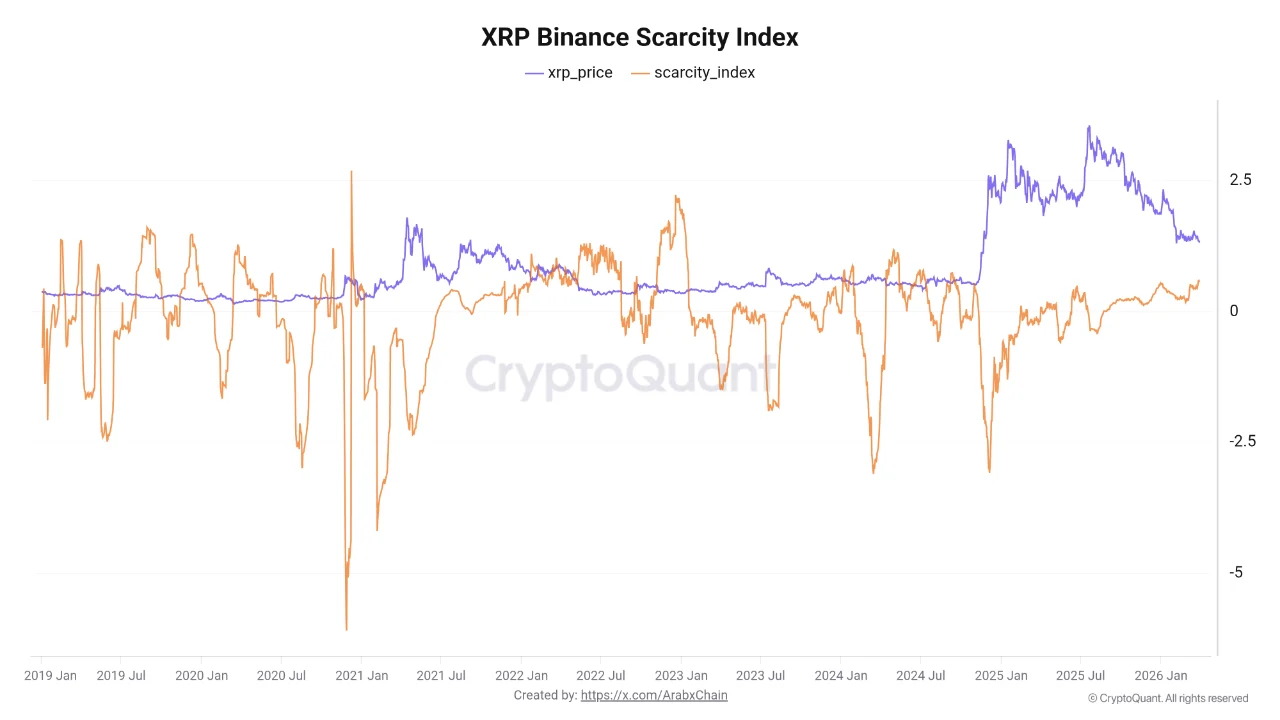
When the index moves into positive territory, it signals that investors are withdrawing coins from exchange custody to hold privately or accumulate long-term. The index previously registered deeply negative values during periods of selling pressure. The move to 0.59 reflects a shift in the opposite direction – fewer coins available to sell, not more.
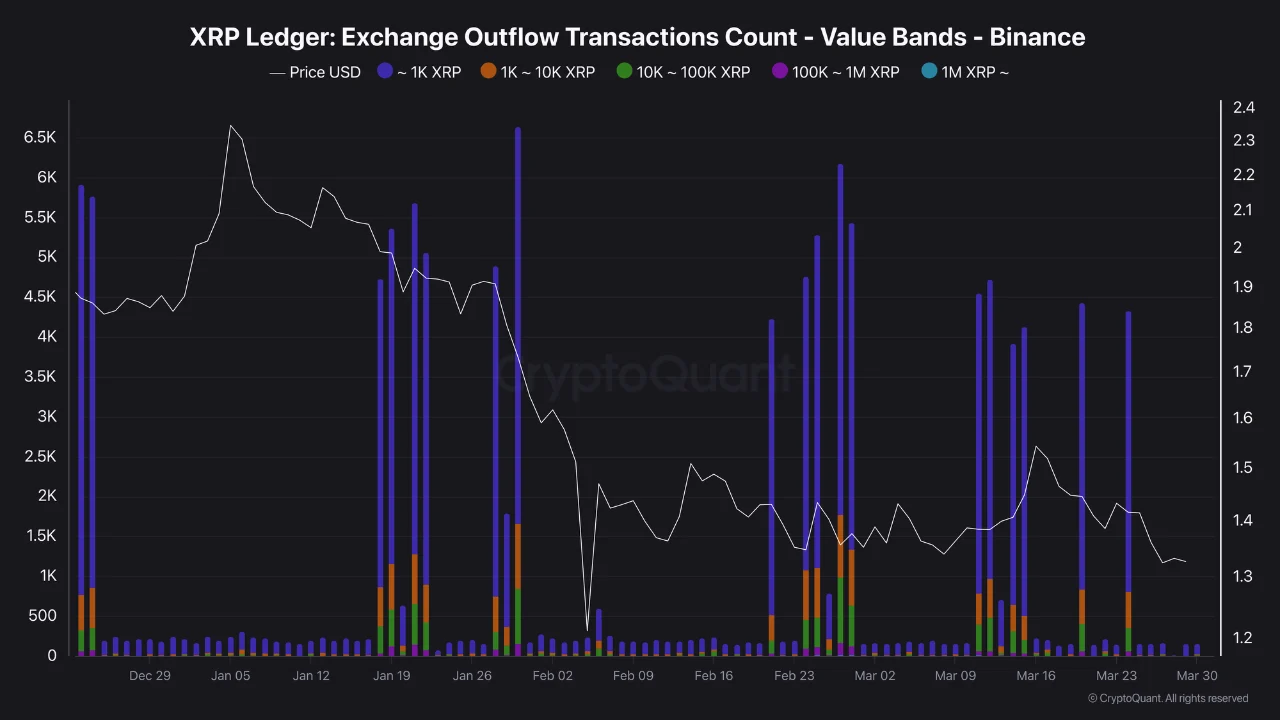
The outflow transaction data confirms the same behaviour at the mid-sized holder level. Since the end of February, outflow transactions on Binance have surged, with several days recording more than 4,000 transactions and peaks approaching 6,000 in a single day. The transaction size profile, dominated by the 1,000 to 100,000 XRP range, identifies mid-sized investors rather than large whales as the primary actors. Mid-sized holders quietly withdrawing XRP from exchange custody while the derivatives market holds an aggressive short position is a specific setup, not a random cluster of activity.
And then there are the ETFs. During the week of March 23–27, XRP ETFs recorded $2.66 million in net inflows. In a week when the broader crypto market saw $414 million in total outflows, XRP was one of the only assets to attract net positive flows. Institutional investors are positioning in XRP products while the derivatives market simultaneously holds its largest short position in weeks.
The Tension and What Resolves It
The divergence between institutional ETF buying and aggressive short positioning in the derivatives market creates a specific near-term scenario. When institutions accumulate through ETFs while the derivatives market loads short, the conditions for a short squeeze are present, a rapid price rise that forces short positions to close, amplifying the upward move. The complication is that institutions anticipating a squeeze may also plan to sell spot into the resulting spike. That produces a sharp rise followed by aggressive selling – the fake breakout pattern the current structure makes probable.
But still A short squeeze in this setup is a probabilistic model rather than a certainty – the conditions are present, but whether they trigger depends on which side moves first and how aggressively.
What separates a genuine recovery from that scenario is the funding rate. If XRP’s price rises while funding rates remain deeply negative, it signals that spot demand is overwhelming the derivative short book rather than triggering a squeeze that gets sold into. That is the strongest bullish signal the current setup can produce. It has not appeared yet.
XRP doesn’t look like a broken asset, but more like a contested one. The accumulation data says one cohort of investors has already made their decision and is acting on it quietly. The liquidity and derivatives data says another cohort is positioned for the opposite outcome, and positioned aggressively. Both cannot be right. The range XRP has been holding for months is where that disagreement is playing out, and whichever side is wrong will be forced to unwind when the range finally breaks.
The funding rate will likely tell you which side that is before the price does.
The information provided in this article is for educational purposes only and does not constitute financial, investment, or trading advice. Coindoo.com does not endorse or recommend any specific investment strategy or cryptocurrency. Always conduct your own research and consult with a licensed financial advisor before making any investment decisions.

Kosta joined the team in 2021 and quickly established himself with his thirst for knowledge, incredible dedication, and analytical thinking. He not only covers a wide range of current topics, but also writes excellent reviews, PR articles, and educational materials. His articles are also quoted by other news agencies.