SHIB Price Faces Another Key Resistance Test

Shiba Inu traded near $0.00000496 on August 2 after a second attempt to reclaim its 100-day moving average failed to produce a daily close above it.
Key Takeaways
- The latest two attempts to recover the 100-day SMA failed by the daily close.
- A spike to approximately 76,500 receiving addresses faded within days.
- The 0.236 Fibonacci retracement near $0.00000550 remains the larger barrier.
Shiba Inu rose roughly 30% into July 26 before giving back a substantial part of the move. SHIB traded near $0.00000496 at the time of writing, less than 3% below its 100-day simple moving average.
Since July 27, the token has remained between the 50-day SMA near $0.00000447 and the 100-day SMA around $0.00000509. Buyers have kept price above the lower average but have not secured a close above the resistance overhead.
SHIB Has Failed Twice Near the 100-Day SMA
SHIB briefly moved above the 100-day SMA on August 1 but closed back below it. The August 2 high reached approximately $0.00000505, stopping just short of the average before price pulled back.
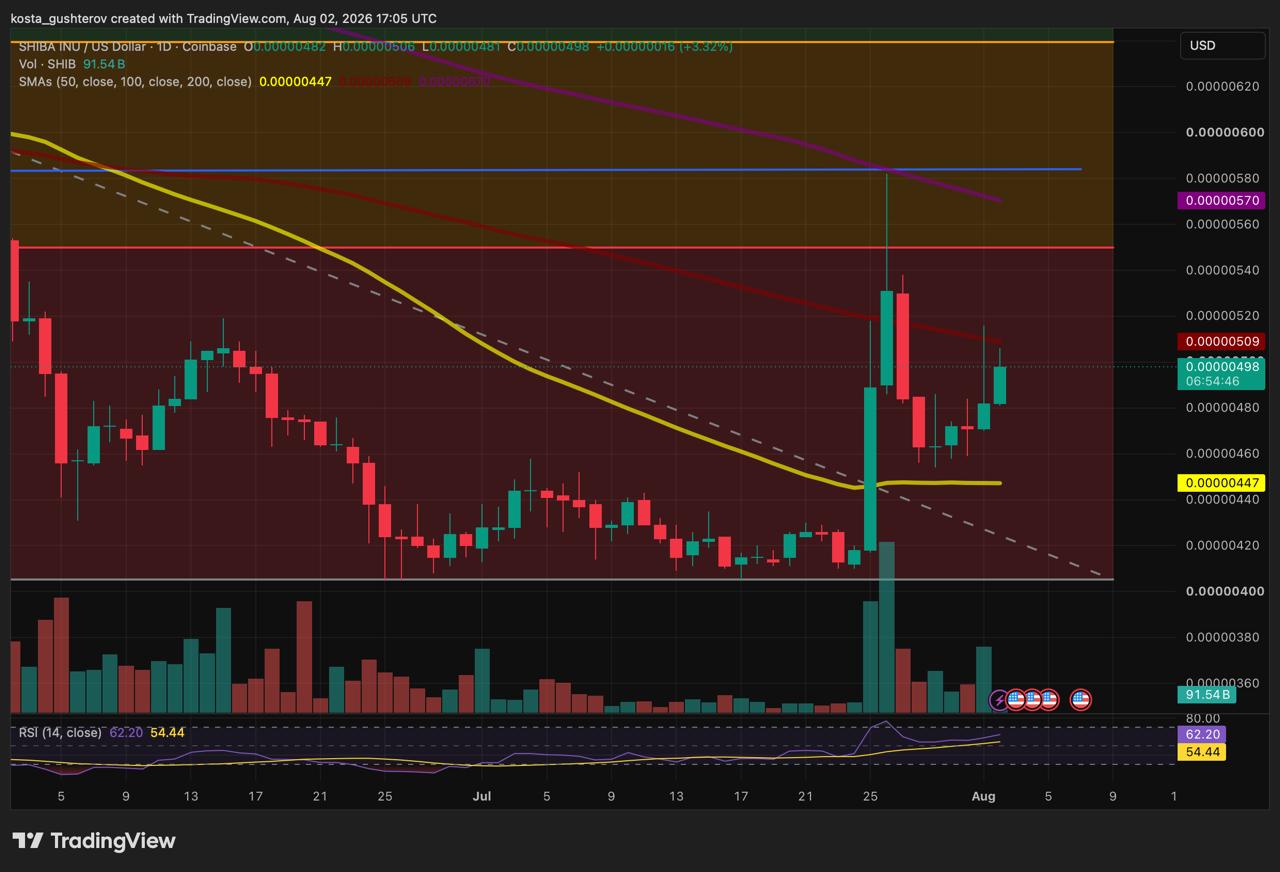
Recent closes have improved and the lows have remained relatively stable. The August 2 peak stayed below the previous session’s high, however, so SHIB has not yet formed a clear sequence of higher highs.
A daily close above $0.00000509 would establish a stronger break than another brief move through the average. Price would then need to remain above the level instead of returning immediately to the range.
Momentum has strengthened without becoming stretched. Daily RSI stood near 62, above its moving average but below overbought territory.
Volume has increased from the quieter part of July but remains below the surge recorded during the July 25–26 advance.
If SHIB continues closing below the 100-day SMA, the recent lows near $0.00000460 form the nearest support, followed by the 50-day average around $0.00000447.
The July Address Spike Did Not Develop Into a Trend
CryptoQuant’s Active Receiving Addresses metric counts the number of unique SHIB addresses that receive a transfer during each observation period. It rose to approximately 76,500 on July 6 before quickly returning to the low-thousands, where it remained for most of the month.
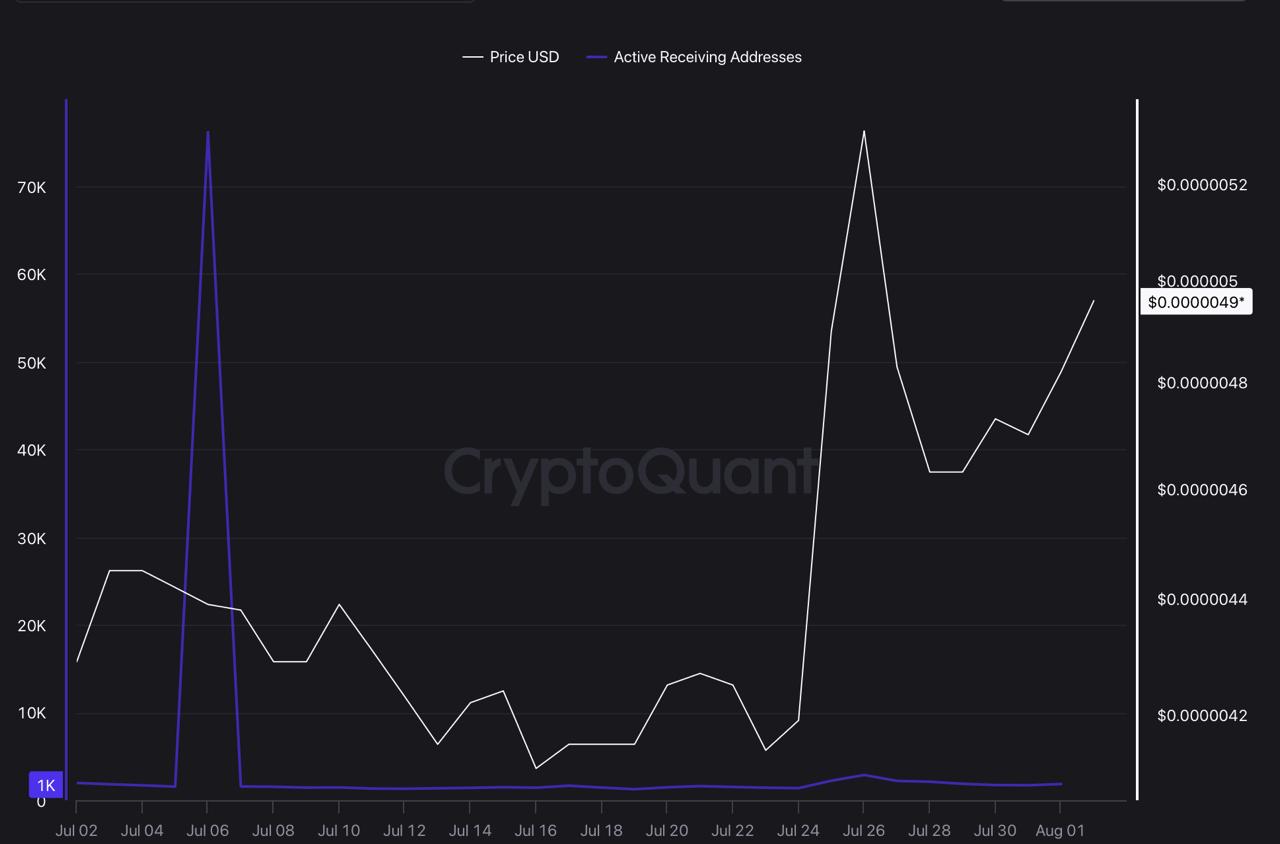
The spike shows that a large number of addresses received SHIB, but the metric cannot determine whether they belonged to new holders, exchanges or existing investors moving tokens between wallets. Exchange activity, wallet restructuring or another one-time network event could also have contributed.
Its timing limits the connection to price. Receiving activity normalized shortly after July 6, while SHIB’s strongest advance arrived almost three weeks later.
Activity edged higher again near the end of the measured period, but the increase remained small compared with the earlier outlier.
Transaction value, exchange flows, new-address growth and trading volume would provide more context about the nature of the transfers. A rise sustained over several weeks would offer clearer evidence that SHIB was reaching a broader group of users than the isolated July 6 reading.

The Larger Barrier Sits Near $0.00000550
A close above the 100-day SMA would improve the daily chart. On the weekly chart, the more significant resistance sits at the 0.236 Fibonacci retracement near $0.00000550.
Holding above $0.00000550 on a weekly basis would move SHIB beyond the range of its current short-term rebound.
Further resistance sits close overhead. The 200-day SMA stands near $0.00000570, followed by a horizontal barrier around $0.00000580.
SHIB must first clear the 100-day average before those higher levels become relevant. Until then, price remains confined between short-term support and the moving average that has stopped both recent recovery attempts.
- Disclaimer: This article is for informational purposes only and does not constitute financial or investment advice. Moving averages, Fibonacci levels, address activity and trading volume do not guarantee future price performance.
- Methodology: The analysis uses the SHIB/USD daily Coinbase chart dated August 2, 2026, including the 50-day, 100-day and 200-day simple moving averages, RSI, volume and Fibonacci levels. Network activity is assessed through CryptoQuant’s Active Receiving Addresses chart covering July 2 through August 1.



Alex is Editor-in-Chief of Coindoo and co-founder of Millennial Media Group, with nearly a decade of experience covering financial markets - crypto first, then everything else. It started in 2016 with Bitcoin. Like most people at the time, he didn't fully understand it - so he kept digging. Blockchain, tokenomics, the projects, the cycles. That curiosity never stopped, and eventually pulled him into traditional markets too: equities, commodities, macro. Not because he left crypto behind, but because you can't properly understand one without the other. What drives him is straightforward: he wants to know why something is happening, not just that it's happening. Most market coverage stops at the headline - price up, price down, here's a chart. Alex finds that kind of reporting actively unhelpful. If you walk away from an article without understanding the mechanism behind the move, what did you actually learn? He holds a degree in Tourism from New Bulgarian University - not the most obvious path into financial markets, but markets have a way of pulling in people who are simply too curious to stay out. He has authored over 200 in-depth analyses and more than 10,000 articles across crypto and traditional finance. He still thinks every day in markets teaches him something new. That's probably why he hasn't stopped.