XRP Traders Question the Trend – But History Suggests Patience May Pay Off
Long-term XRP holders are viewing current price action as a test of conviction rather than weakness.
Key Takeaways:
- XRP remains range-bound between $2.20 and $2.60, causing some bulls to turn cautious.
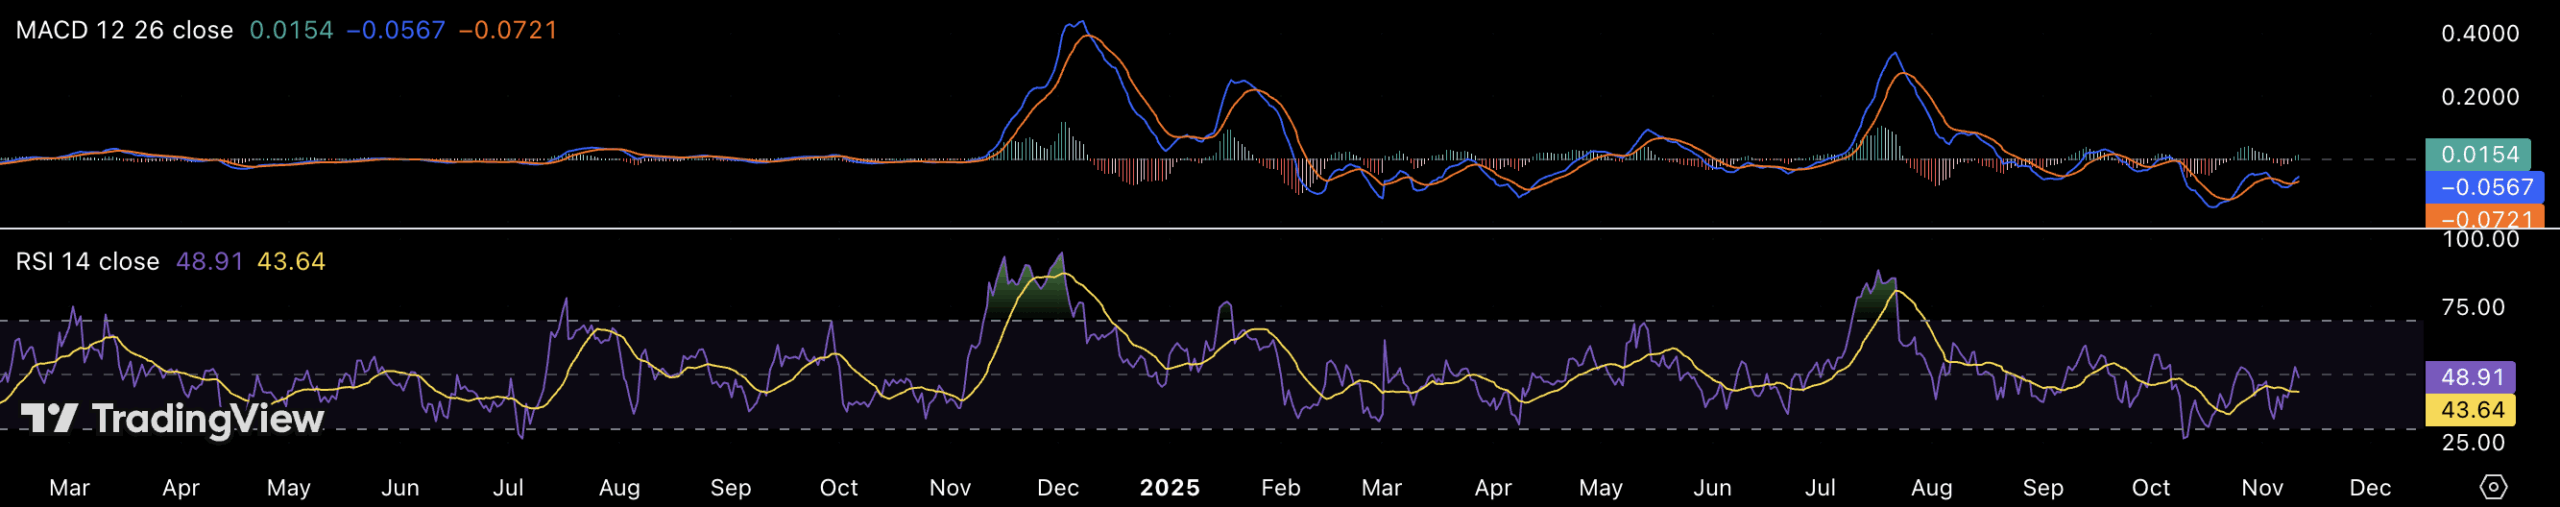
- RSI and MACD indicators show neutral-to-bullish momentum buildup.
- Historical patterns suggest XRP often consolidates before large breakouts.
- Technical targets from EGRAG CRYPTO project potential moves toward $10–$37.
The recent consolidation in XRP’s price has sparked frustration among bullish traders, with many beginning to question whether the momentum that once fueled the token’s major rallies has faded. Yet, according to technical patterns and historical behavior, what appears to be stagnation could actually be the calm before an explosive move.
In recent weeks, XRP has traded in a narrow range around the $2.40 level, bouncing between $2.20 and $2.60. This range-bound action has led to a growing number of traders turning cautious, interpreting the lack of breakout as weakness on higher time frames. However, analysts argue that this type of prolonged compression has historically preceded XRP’s strongest surges.
#XRP – ⚔️ Weakness? Or Just Testing the Faith of Bulls? 💎
Lately, I’ve seen many #XRP Bulls turning #Bearish 😔, frustrated by the sideways chop and the boring price action. They say things like “I see weakness on the HTF.”
Let me tell you what I see 👁️🗨️:
I see traders… pic.twitter.com/5WTibse9r7— EGRAG CRYPTO (@egragcrypto) November 11, 2025
Technical analyst EGRAG CRYPTO points to recurring cyclical structures that have defined previous XRP rallies. On his long-term chart, the token appears to be replicating setups seen before its major 2017 and 2021 breakouts. Both historical instances followed months of sideways trading before XRP erupted into double- and even triple-digit percentage gains.

Momentum Building Under the Surface
Supporting this thesis, the latest momentum indicators show that XRP may be preparing for another leg higher. The daily Relative Strength Index (RSI) sits near 49, suggesting neutral conditions rather than overbought weakness. Meanwhile, the MACD histogram is turning positive, indicating a possible shift in momentum toward buyers.
On the macro chart, EGRAG highlights two major target zones he labels “Green” and “Blue,” corresponding to Fibonacci extensions near $10 and $37, respectively. These levels echo the scale of previous parabolic rallies, suggesting that if the pattern holds, XRP could once again deliver face-melting gains within a 4–6 week window once the breakout occurs.
Testing the Faith of the Bulls
While some traders are protecting their profits from earlier runs, others remain steadfast in their conviction. EGRAG’s message to the community is clear: uncertainty shouldn’t turn into collective fear. The current period of low volatility, he argues, is more likely testing the patience and faith of long-term holders rather than signaling a breakdown.
In his words, the market is “testing who truly believes.” And based on XRP’s history, moments like these have often come just before a significant move upward.
The information provided in this article is for educational purposes only and does not constitute financial, investment, or trading advice. Coindoo.com does not endorse or recommend any specific investment strategy or cryptocurrency. Always conduct your own research and consult with a licensed financial advisor before making any investment decisions.


Alex is an experienced financial journalist and cryptocurrency enthusiast. With over 8 years of experience covering the crypto, blockchain, and fintech industries, he is well-versed in the complex and ever-evolving world of digital assets. His insightful and thought-provoking articles provide readers with a clear picture of the latest developments and trends in the market. His approach allows him to break down complex ideas into accessible and in-depth content. Follow his publications to stay up to date with the most important trends and topics.