Bitcoin Is Up From Its Lows – On-Chain Data Says Bear Market Runs Until Late 2026

After getting cut nearly in half from its January highs above $105K, Bitcoin has clawed back into the low-to-mid $70K range and is now pushing against its first meaningful resistance zone - somewhere between $76K and $80K - in what's shaping up to be the market's first genuine attempt at recovery since the selloff began.
Key Takeaways
- Bitcoin is recovering from its February lows and testing resistance between $76K–$80K
- Buyer activity has returned to spot markets after months of heavy selling pressure
- On-chain models suggest the current bear phase could last until late 2026
- The trend is improving, but no major breakout signal has been confirmed yet
Analyst Michaël van de Poppe flagged the move earlier today, noting that Bitcoin is beginning to build what looks like a monthly engulfing candle – a setup that, in technical analysis, tends to signal a shift from bearish to bullish momentum. He stopped short of calling a full reversal, though. “I don’t think we’ll pass that in one-go,” he wrote, pointing to the dense cluster of overhead resistance sitting just above current prices.
That resistance isn’t arbitrary – looking at the chart, there are multiple unfilled liquidity zones stacked between $76K and $92K, essentially a ceiling of sellers who bought at higher prices and are now waiting for a chance to exit at break-even. Until Bitcoin can absorb that supply, any rally is working against the clock.
#Bitcoin starts to trend upwards and is on its way towards the next resistance around $76-80K.
I don't think we'll pass that in one-go, but atleast we're building a monthly engulfing and, slowly, but surely, the sentiment switches. pic.twitter.com/KyhGaOczzf
— Michaël van de Poppe (@CryptoMichNL) March 17, 2026
The Selling Finally Stopped – For Now
CryptoQuant’s data tells a more nuanced story about what’s been happening beneath the surface. Their Bitcoin Spot Net Volume Delta chart – which tracks real buying and selling activity across Coinbase and Binance – shows that for the first time since early February, net buyer activity has turned positive. The weeks prior were dominated by sustained red bars well into the negative $100M+ range, meaning sellers were overwhelming buyers by a significant margin on a near-daily basis throughout the February drawdown.
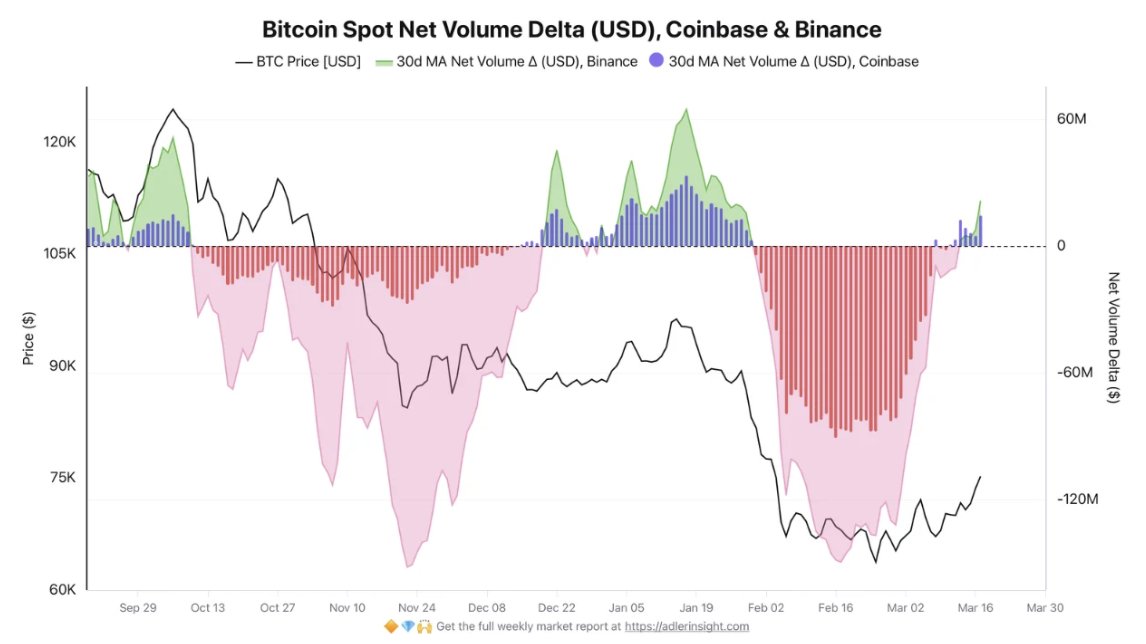
Analyst Darkfost noted the shift is “encouraging after a period dominated by selling pressure,” while also making clear this isn’t a green light just yet, adding that “this trend still needs confirmation.” That’s the right read. One week of positive delta after months of consistent selling doesn’t rewrite the macro picture, but what it does indicate is that the worst of the panic-driven capitulation has likely passed and the market is starting to attract willing buyers again at these levels. The Coinbase data is worth watching particularly closely here, given that the exchange tends to reflect institutional and U.S.-based retail behavior more accurately than Binance – and when Coinbase net volume turns positive in a sustained way, it has historically been a more reliable signal of real accumulation rather than speculative bouncing.
READ MORE:

Argentina Officially Bans Polymarket – Here Are the 35+ Countries That Already Did the Same
Zooming Out: Bear Markets Don’t End Overnight
The third piece of data is the one that should temper any near-term excitement most effectively. A widely circulated analysis from OnchainMind pulled together four separate on-chain frameworks to estimate how long Bitcoin bear markets typically last, and the results cluster uncomfortably around 10 to 12 months across multiple models – mean reversion indicators, statistical deviation frameworks, and long-term holder stress metrics all point to similar timelines, with the final capitulation phase alone historically taking around 7 months to fully play out. If the current cycle’s top was in January 2026, that puts a potential regime shift somewhere around late 2026, not next month.
This doesn’t mean Bitcoin can’t stage a meaningful rally from here, and the technical setup certainly supports a move higher in the near term. But it does mean that anyone expecting a clean run back to $100K+ in the coming weeks is likely misreading where we are in the broader cycle. Bear market rallies can be sharp, fast, and convincing – which is precisely what makes them dangerous for traders who mistake momentum for trend reversal.
How long do Bitcoin bear markets usually last?
Looking across multiple frameworks:
• Mean reversion indicators: ~10 months
• Statistical deviation models: ~12 months
• Long-term holder stress: ~12 months
• Final capitulation phase: ~7 monthsIf history rhymes, many… pic.twitter.com/N2KAdMZKtC
— On-Chain Mind (@OnChainMind) March 17, 2026
What This All Adds Up To
The picture right now is one of cautious stabilization – selling pressure has eased, buyers are re-entering the market, and the price is attempting to reclaim structure after a brutal two-month decline. The next few weeks will be genuinely telling in terms of whether this recovery has legs. If Bitcoin can clear $80K with sustained volume and continued positive spot delta, the case for a more meaningful recovery strengthens considerably. If it stalls at current levels and rolls back over, the $65K–$66K support zone tested earlier this month comes back into play, and that conversation becomes considerably harder to have. For now, the worst may be behind us – but the best is not yet clearly in front.
The information provided in this article is for educational purposes only and does not constitute financial, investment, or trading advice. Coindoo.com does not endorse or recommend any specific investment strategy or cryptocurrency. Always conduct your own research and consult with a licensed financial advisor before making any investment decisions.


Alexander Zdravkov is a person who always looks for the logic behind things. He has more than 3 years of experience in the crypto space, where he skillfully identifies new trends in the world of digital currencies. Whether providing in-depth analysis or daily reports on all topics, his deep understanding and enthusiasm for what he does make him a valuable member of the team.