Bitcoin Enters High-Risk Zone After Mass Long Liquidations

Bitcoin’s latest pullback is doing more than just shaking price levels - it is actively flushing out market positioning.
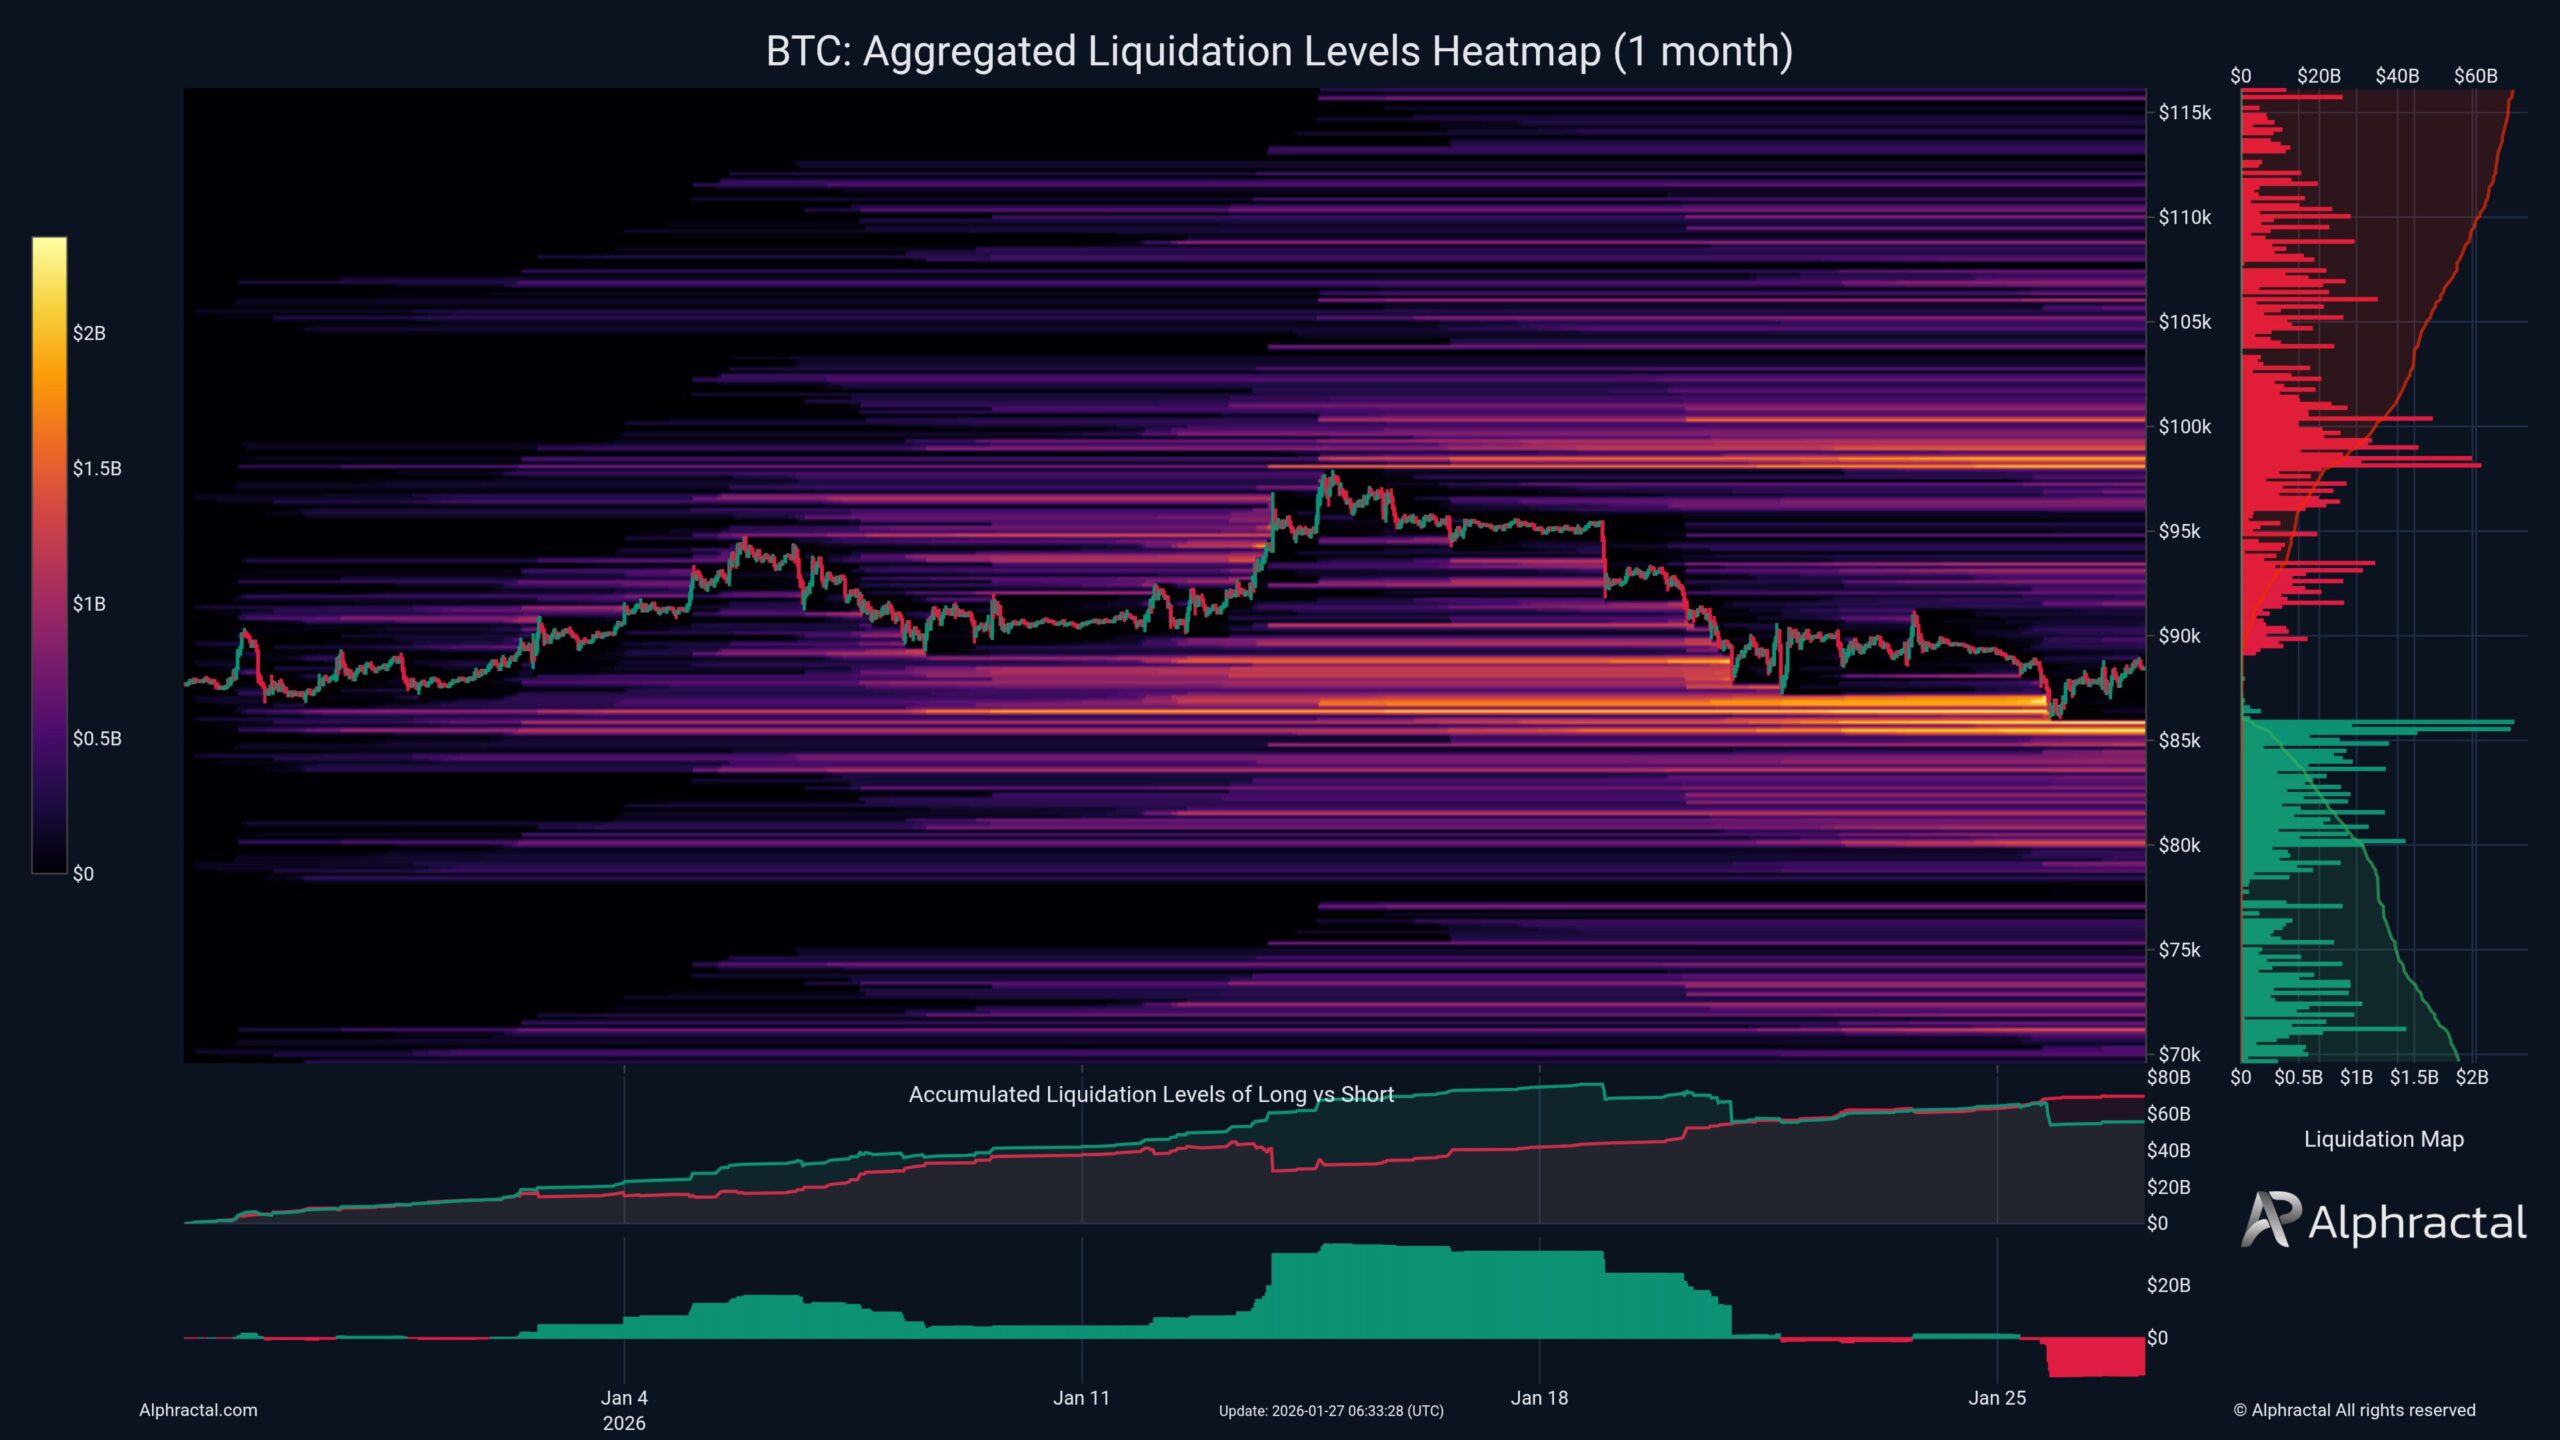
According to data highlighted by crypto analyst Joao Wedson, a significant share of long positions opened over the past month has already been liquidated, underscoring how crowded the bullish trade had become.
Key Takeaways
- A large portion of recent Bitcoin long positions has been liquidated, highlighting crowded bullish positioning.
- The loss of the 89.2k level and a rising Risk Index are reinforcing near-term bearish sentiment.
- The 84.5k zone is now critical – holding it could stabilize price, while a breakdown may open the door to a deeper move toward the mid-70k area.
This wave of liquidations suggests that most traders were leaning heavily toward further upside. As price slipped, that imbalance created ideal conditions for exchanges and larger players to hunt liquidity, pushing Bitcoin lower to force weak hands out of their positions.
Liquidation pressure reshapes market structure
Heatmap data tracking aggregated liquidation levels over the past 30 days shows dense clusters of long exposure being cleared as Bitcoin drifted lower. Rather than a single capitulation event, the move resembles a slow bleed, with leverage steadily unwinding as price fails to reclaim prior highs.
This behavior fits a familiar pattern in crypto markets. When consensus becomes too one-sided, price often moves in the opposite direction, targeting areas where stop losses and liquidation levels are stacked. The result is a market that looks technically weak, even if broader conviction remains intact.
Risk Index climbs as key support breaks
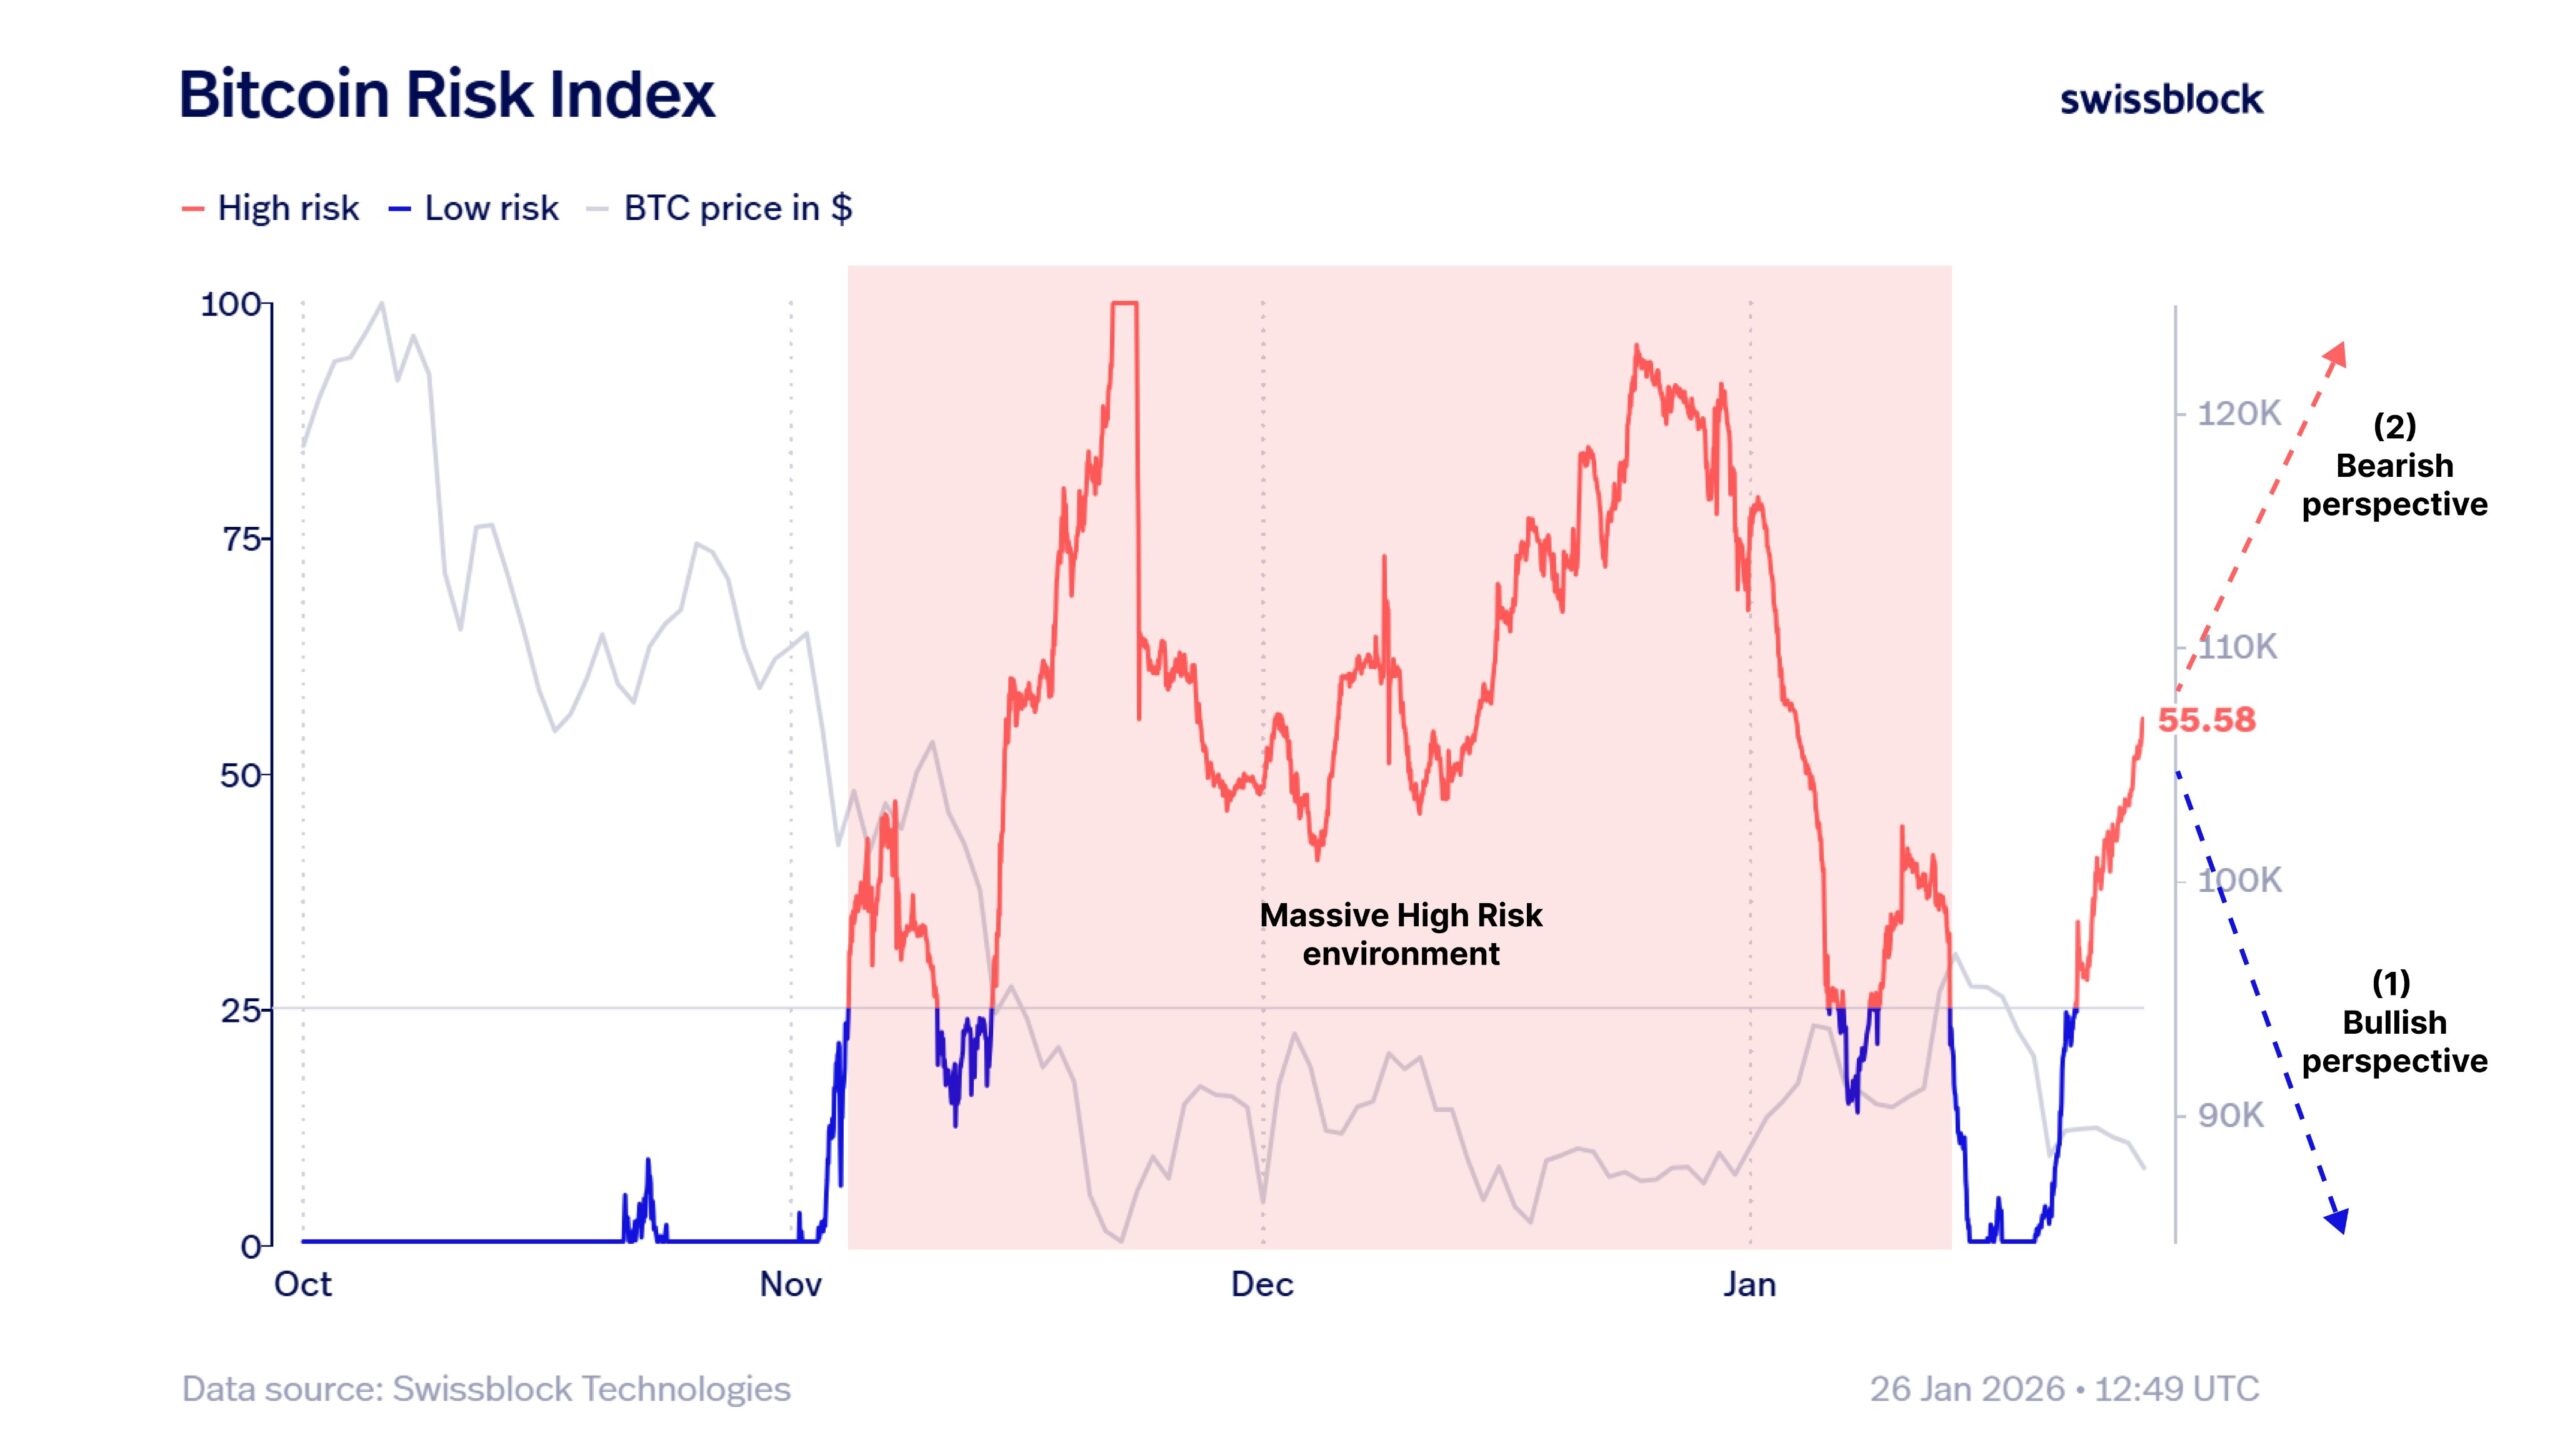
Recent price action has reinforced a bearish short-term outlook. Bitcoin lost the 89.2k support zone, a level that had acted as a pivot throughout January. At the same time, the Bitcoin Risk Index continued to rise, signaling a higher-risk environment and worsening sentiment.
Historically, elevated readings in the Risk Index have coincided with periods of volatility and downside pressure. While not a timing tool on its own, the combination of rising risk and falling price suggests traders remain cautious and defensive.
84.5k becomes the market’s battleground
Despite the bearish momentum, bulls are still defending a crucial area near 84.5k. This zone now represents the immediate downside target and the last meaningful support before a deeper correction comes into play.
If price dips into this region and quickly recovers, especially alongside cooling risk metrics, it could open the door for higher-conviction long entries. A brief liquidity sweep below support would not be unusual in that scenario.

On the other hand, a clean break and sustained consolidation below 84.5k would likely shift the broader structure lower. In that case, attention would turn to levels below the November range, with the mid-70k area emerging as a primary downside target.
Momentum indicators send mixed signals
Short-term technicals reflect the market’s indecision. On the 4-hour chart, momentum has weakened following the recent sell-off, while RSI remains subdued and below neutral levels. MACD readings show limited upside momentum, suggesting buyers have yet to regain control.
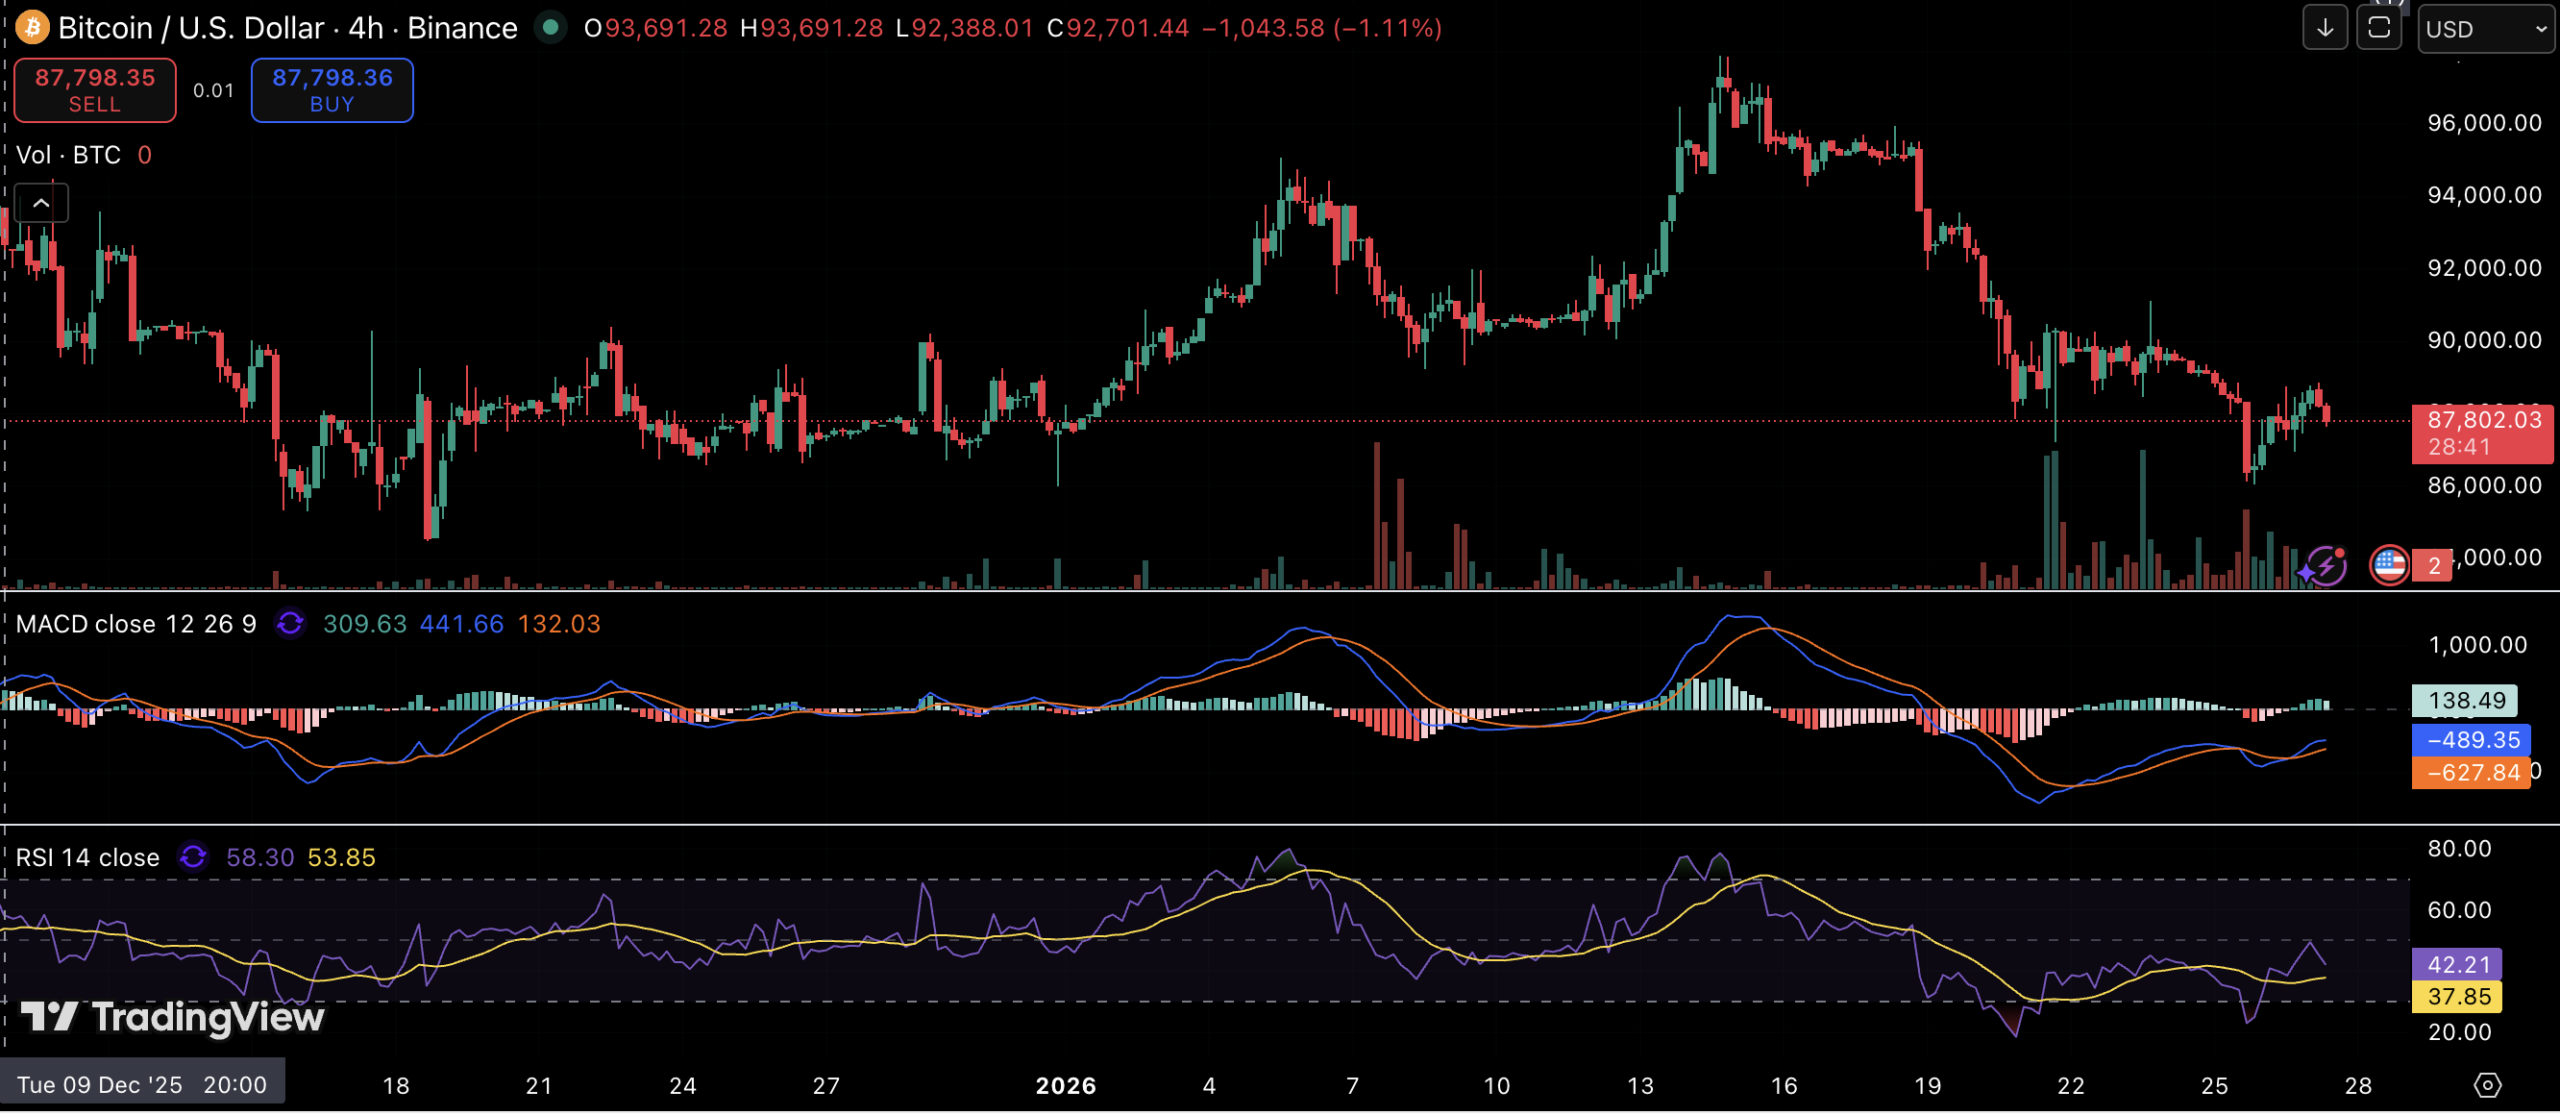
At the same time, selling pressure appears more controlled than during sharp capitulation phases, pointing to a market that is correcting rather than collapsing.
The information provided in this article is for educational purposes only and does not constitute financial, investment, or trading advice. Coindoo.com does not endorse or recommend any specific investment strategy or cryptocurrency. Always conduct your own research and consult with a licensed financial advisor before making any investment decisions.


Alex is an experienced financial journalist and cryptocurrency enthusiast. With over 8 years of experience covering the crypto, blockchain, and fintech industries, he is well-versed in the complex and ever-evolving world of digital assets. His insightful and thought-provoking articles provide readers with a clear picture of the latest developments and trends in the market. His approach allows him to break down complex ideas into accessible and in-depth content. Follow his publications to stay up to date with the most important trends and topics.